Fig. 3.
Download original image
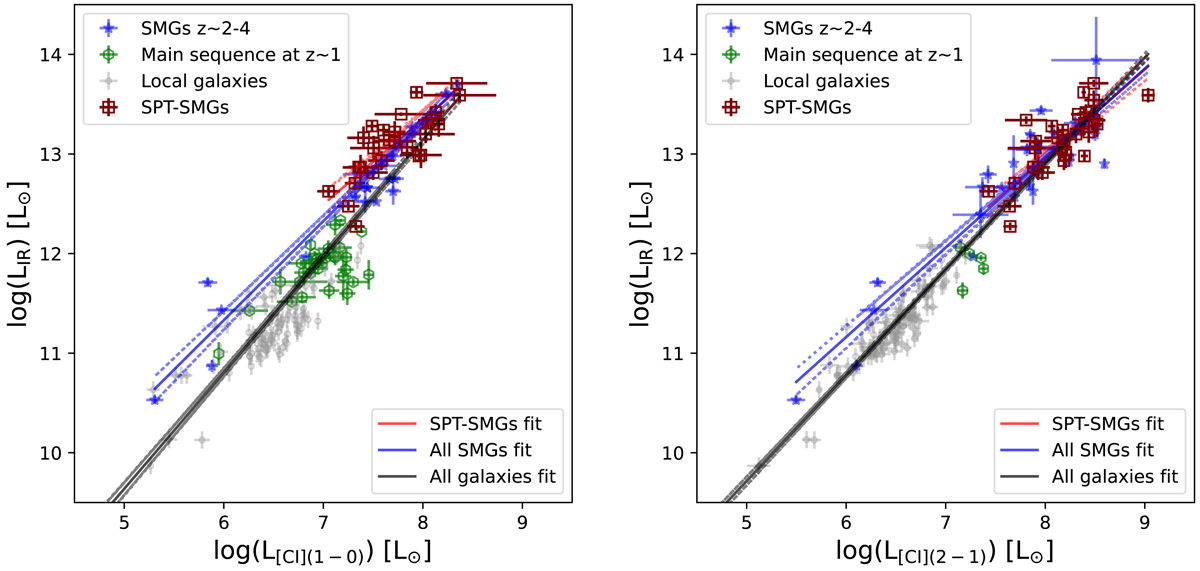
Infrared luminosities vs. [CI] line luminosities for our sample. The left panel shows the LIR against L[CI](1−0) for our sample and the right panel shows the LIR against L[CI](2−1) for our sample. Both the luminosities are corrected for magnification and are in units of L⊙. The ACA-[CI] sample is represented by red squares. Our sample is compared with the Valentino et al. (2020) compilation. The blue stars represent the SMGs (Walter et al. 2011; Alaghband-Zadeh et al. 2013; Bothwell et al. 2017; Yang et al. 2017; Andreani et al. 2018; Cañameras et al. 2018; Nesvadba et al. 2019; Dannerbauer et al. 2019; Jin et al. 2019). The main-sequence galaxies at z ∼ 1 are represented by green hexagons (Valentino et al. 2018; Bourne et al. 2019; Valentino et al. 2020). The local FTS samples of star-forming galaxies are represented by grey circles (Véron-Cetty & Véron 2010; Liu et al. 2015; Kamenetzky et al. 2014). The fit for the entire compilation is represented as the grey solid line. The blue line represents the fit for our sample combined with the literature SMGs, and the red line represents the fit for our sample. The 1σ limit of the fit is represented as dashed lines.
Current usage metrics show cumulative count of Article Views (full-text article views including HTML views, PDF and ePub downloads, according to the available data) and Abstracts Views on Vision4Press platform.
Data correspond to usage on the plateform after 2015. The current usage metrics is available 48-96 hours after online publication and is updated daily on week days.
Initial download of the metrics may take a while.