Fig. 9
Download original image
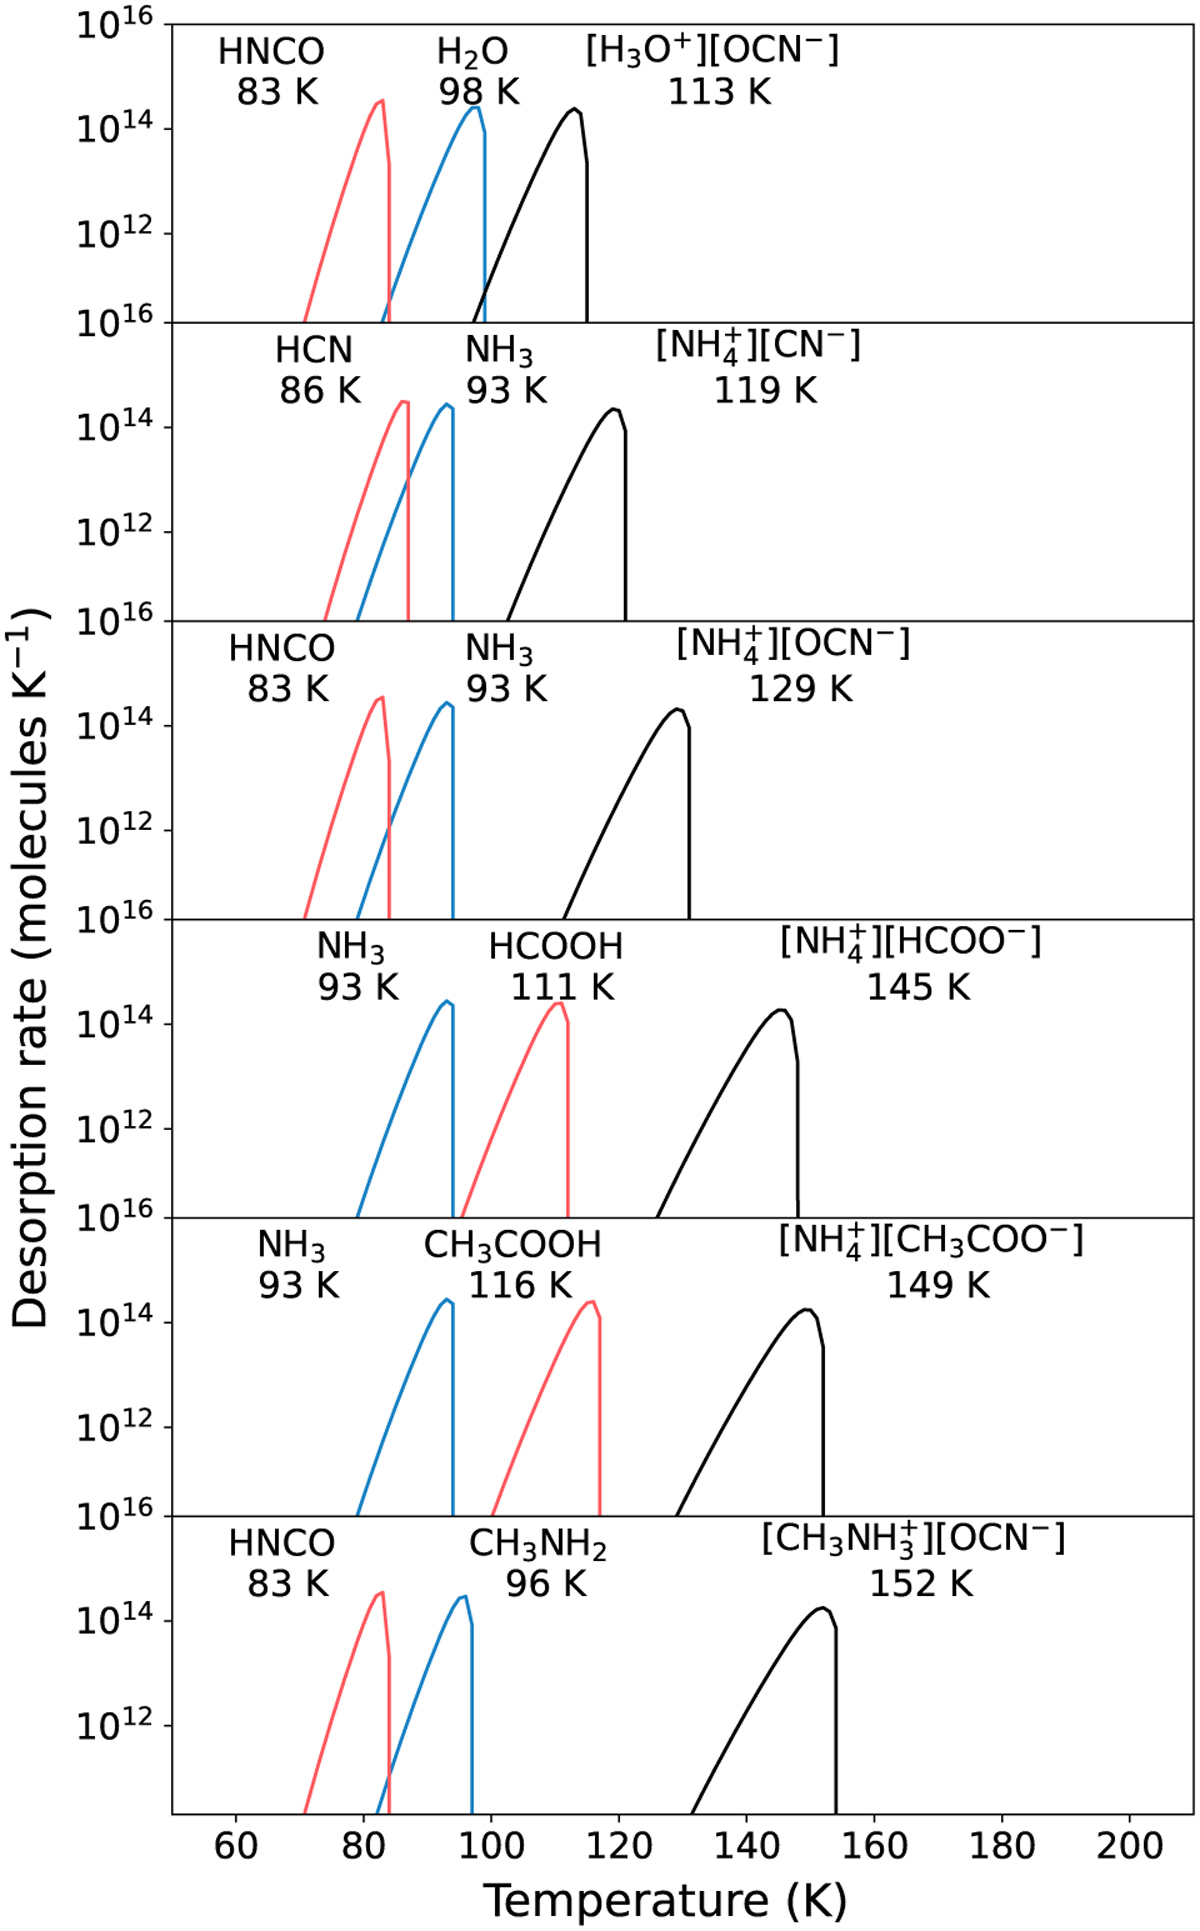
Desorption profiles of acids (red), bases (blue), and the resulting salt (black). Desorption energies and pre-factors for H2O, NH3, and HCN are obtained from Minissale et al. (2022), while the parameters for the remaining molecules are taken from Table 1. Peak desorption temperatures are indicated in the plot for each species. The desorption profile is simulated with a first-order Polanyi-Wigner equation, surface coverage of 1015 molecules cm−2 and heating rate of 1 K century−1.
Current usage metrics show cumulative count of Article Views (full-text article views including HTML views, PDF and ePub downloads, according to the available data) and Abstracts Views on Vision4Press platform.
Data correspond to usage on the plateform after 2015. The current usage metrics is available 48-96 hours after online publication and is updated daily on week days.
Initial download of the metrics may take a while.