Fig. 8
Download original image
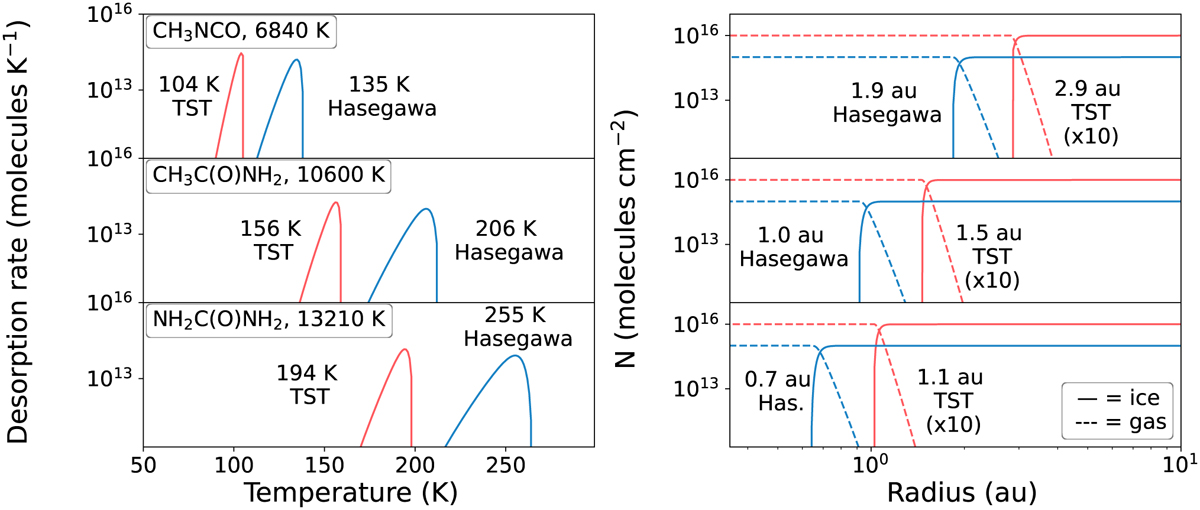
Comparison of desorption profiles generated with the TST (red) or the Hasegawa (blue) prefactor. Left panel: Desorption profiles of CH3NCO, CH3C(O)NH2, and NH2C(O)NH2. The desorption energies are determined with the Redhead-TST method using data from Ligterink et al. (2017, 2018a; see Table A.2 and top left corners). Desorption profiles are plotted for vTST (red) and with vHasegawa (blue). The desorption profile is simulated with a first-order Polanyi-Wigner equation, surface coverage of 1 × 10¹⁵ molecules cm−2, and heating rate of 1 K century−1. Peak desorption temperatures decrease by ~30% when realistic pre-factors are used. Right panel: Ice (solid) and gas (dashed) abundances plotted against radius (au) of a protoplanetary disk for vTST (red) and with vHasegawa (blue). An average disk temperature profile of T(r) = 200 × (r/1 AU)0.62 K is used (Andrews & Williams 2007). For each 1 K temperature step, the number of desorbed molecules is determined, which summed give the gas-phase column density and subtracted from a starting value of 1 × 1015 cm−2 give the ice column density. The TST abundances are offset by a factor of 10 for easier viewing. The peak radii of the ice-gas inversion are indicated and are shown to shift outward by ~50% when realistic pre-factors are used.
Current usage metrics show cumulative count of Article Views (full-text article views including HTML views, PDF and ePub downloads, according to the available data) and Abstracts Views on Vision4Press platform.
Data correspond to usage on the plateform after 2015. The current usage metrics is available 48-96 hours after online publication and is updated daily on week days.
Initial download of the metrics may take a while.