Fig. 6.
Download original image
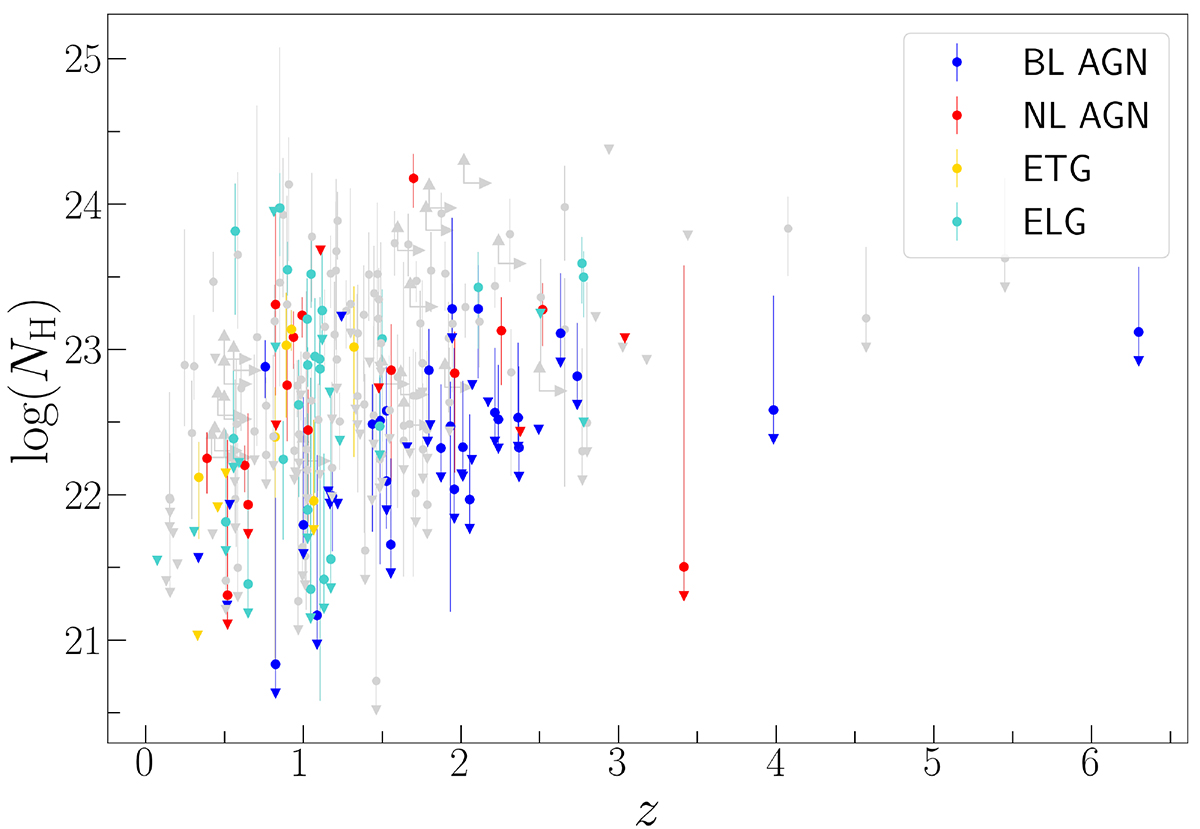
NH-redshift distribution of all the objects in the catalog. Up- and right-pointing arrows show the redshift and NH lower limits for objects with a flat photometric redshift probability curve. Upper limits are shown as down-pointing triangles. The spectral types are color-coded: red, NL-AGN, blue, BL-AGN, yellow, Early Type Galaxies, aquamarine, Emission Line Galaxies, gray, no spectral identification
Current usage metrics show cumulative count of Article Views (full-text article views including HTML views, PDF and ePub downloads, according to the available data) and Abstracts Views on Vision4Press platform.
Data correspond to usage on the plateform after 2015. The current usage metrics is available 48-96 hours after online publication and is updated daily on week days.
Initial download of the metrics may take a while.