Fig. 1.
Download original image
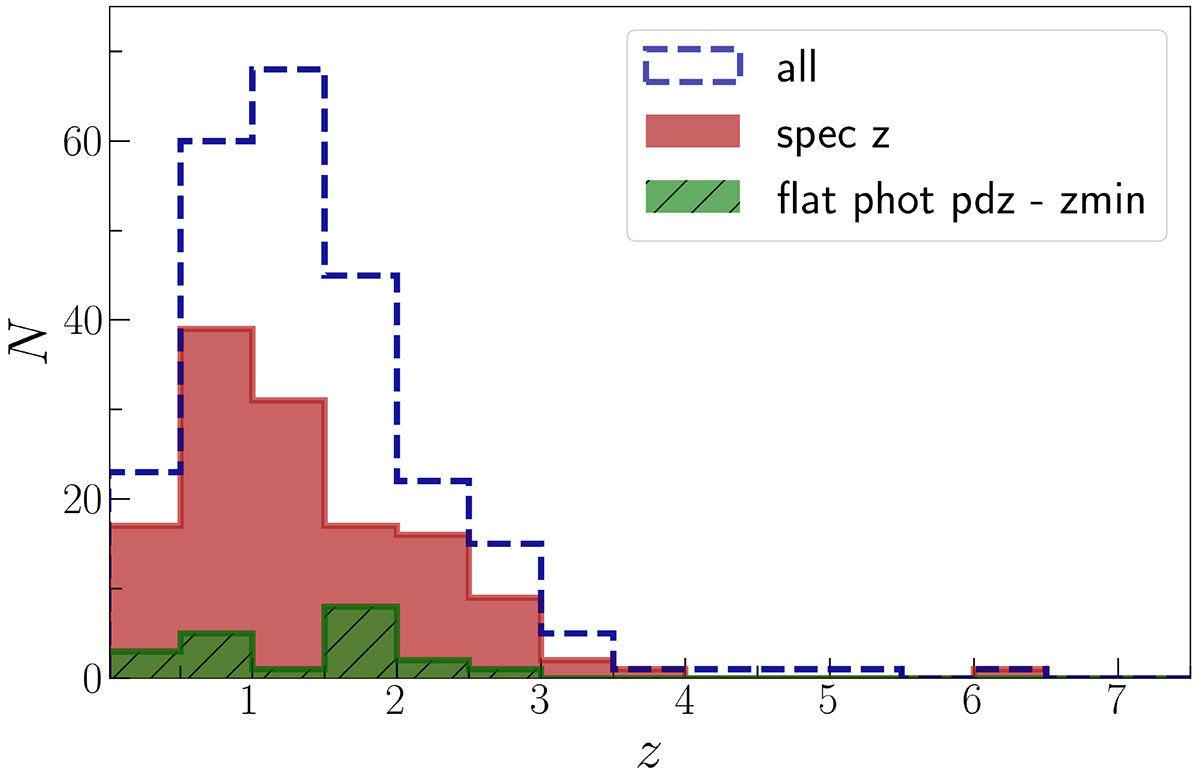
Redshift distribution of the J1030 Chandra catalog. The histograms show the distribution for the whole sample (blue dashed) and the distribution for the objects with spectroscopic redshift (red filled). A spectroscopic redshift is available for 135 out of 243 objects. Also shown is the redshift lower limit for the 20 objects for which the photometric redshift probability distribution is flat (green striped).
Current usage metrics show cumulative count of Article Views (full-text article views including HTML views, PDF and ePub downloads, according to the available data) and Abstracts Views on Vision4Press platform.
Data correspond to usage on the plateform after 2015. The current usage metrics is available 48-96 hours after online publication and is updated daily on week days.
Initial download of the metrics may take a while.