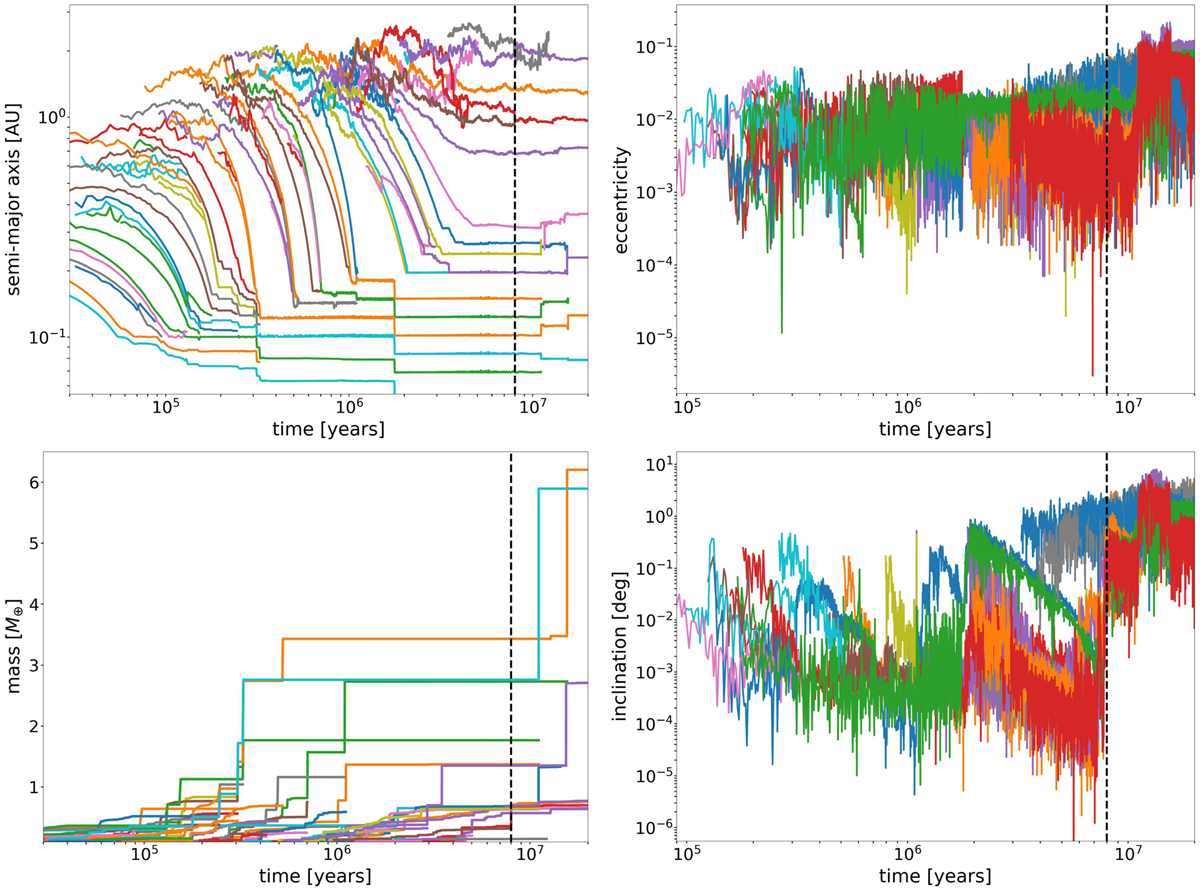
Fig. 4
Download original image
Dynamical evolution of planets in one of the typical systems that underwent several late dynamical instabilities after the gas dispersal. The plots show the temporal evolution (20 Myr) of planetary bodies, specifically their semimajor axes, masses, eccentricities, and orbital inclinations. Each line color represents an individual object; however, the color is random in each plot. The dashed black line shows the estimated time of the gas dissipation at ~8 Myr. For better visualization, the panels on the left (semimajor axes and masses) show the evolution of all bodies with masses > 0.1 M⊕, and the panels on the right (eccentricities and orbital inclinations) show only bodies with masses > 0.5 M⊕.
Current usage metrics show cumulative count of Article Views (full-text article views including HTML views, PDF and ePub downloads, according to the available data) and Abstracts Views on Vision4Press platform.
Data correspond to usage on the plateform after 2015. The current usage metrics is available 48-96 hours after online publication and is updated daily on week days.
Initial download of the metrics may take a while.