Fig. 3
Download original image
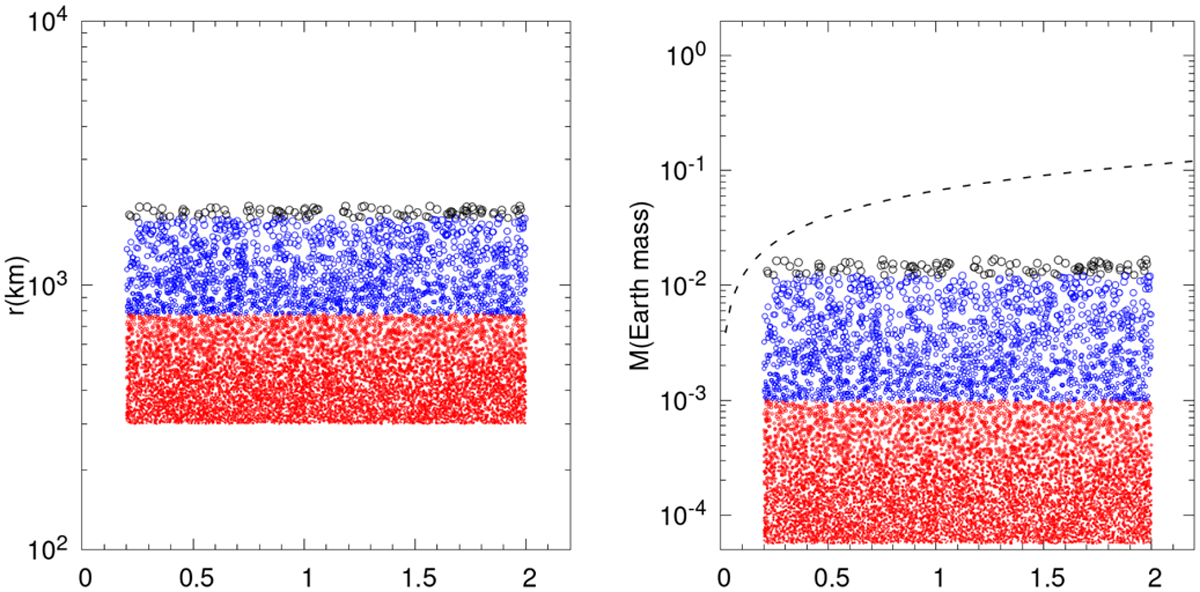
Initial distribution, masses, and radii of 12 000 bodies for a simulation with an initial solid disk mass of 10 M⊕. The x-axis represents the distance from the central star in AU, and the y-axis the radii (left panel) and masses (right panel). Red, blue, and black indicate different mass ranges of the objects, i.e., mass M < 10−3 M⊕ (considered as planetesimals), 10−3M⊕ < M < 10−2 M⊕ (proto-embryos), and M > 10−2 M⊕ (embryos), respectively. There is no difference in the treatment of these objects during the N-body simulations. The isolation mass, which is the mass of embryos that accreted all the bodies within their feeding zone, is represented by the dashed line.
Current usage metrics show cumulative count of Article Views (full-text article views including HTML views, PDF and ePub downloads, according to the available data) and Abstracts Views on Vision4Press platform.
Data correspond to usage on the plateform after 2015. The current usage metrics is available 48-96 hours after online publication and is updated daily on week days.
Initial download of the metrics may take a while.