Fig. 27
Download original image
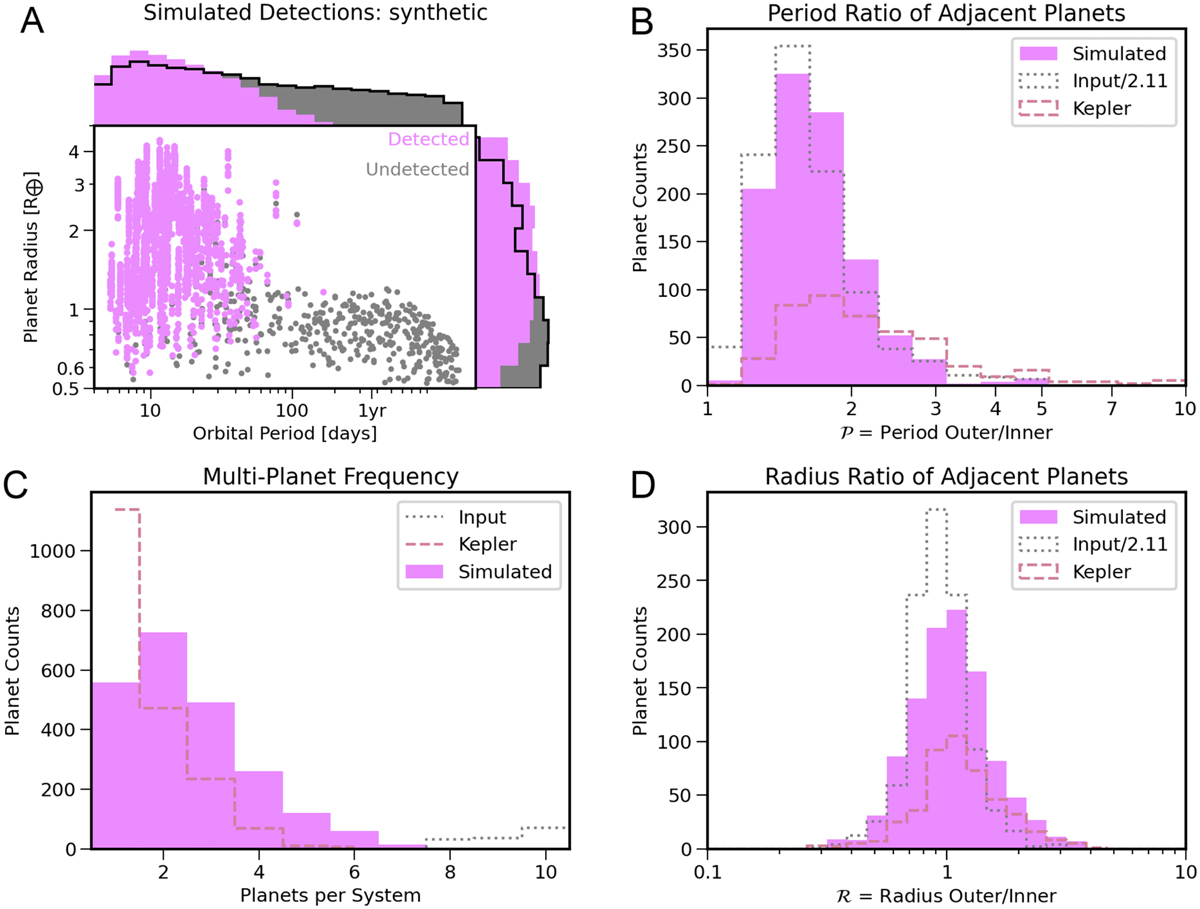
Synthetic EPOS (Mulders et al. 2018, 2019) observations of our simulated population (A) and the associated statistics of the systems (B–D). Panel A shows the orbital periods and planet radii (calculated using a mass-radius relation from Chen & Kipping 2016) of detected planets (in magenta) and undetected planets (in gray). The statistics in panels B–D show the intrinsic distribution of our systems’ properties with dotted gray lines, the synthetic observable distribution in magenta, and the distribution observed with Kepler in dashed red lines. Plot B displays the distribution of period ratios between adjacent planet pairs. Plot C shows the frequency of multi-planet systems, and plot D the distribution of radius ratios of the adjacent planet pairs. All statistics are calculated for planets with orbital periods between 1 and 400 days and radii between 0.5 and 5 R⊕.
Current usage metrics show cumulative count of Article Views (full-text article views including HTML views, PDF and ePub downloads, according to the available data) and Abstracts Views on Vision4Press platform.
Data correspond to usage on the plateform after 2015. The current usage metrics is available 48-96 hours after online publication and is updated daily on week days.
Initial download of the metrics may take a while.