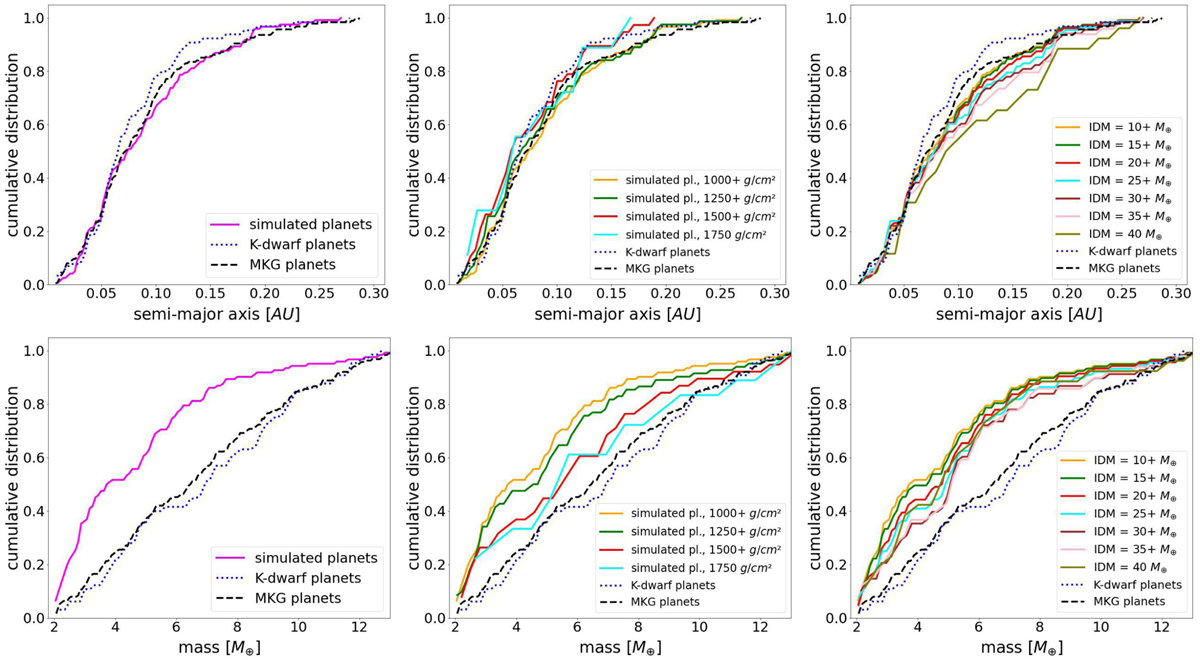
Fig. 26
Download original image
Cumulative distributions of the simulated semimajor axes (the top row) and planetary masses (the bottom row) for the whole population (the left column), for different gas surface densities (the middle column), and for different initial disk masses (IDM, the right column). IDM = 10 + M⊕ means that only systems starting with a disk mass of 10 M⊕ or more are considered for that distribution. The same is true for the other IDMs as well as for the gas surface density values, e.g., 1000+ g cm−2. IDM = 5+ M⊕ contains only a few very small planets compared to IDM = 10 + M⊕; therefore, we omitted that distribution. Cumulative distributions for the K-dwarf (blue dotted line) and MKG (dashed black line) samples are displayed for comparison.
Current usage metrics show cumulative count of Article Views (full-text article views including HTML views, PDF and ePub downloads, according to the available data) and Abstracts Views on Vision4Press platform.
Data correspond to usage on the plateform after 2015. The current usage metrics is available 48-96 hours after online publication and is updated daily on week days.
Initial download of the metrics may take a while.