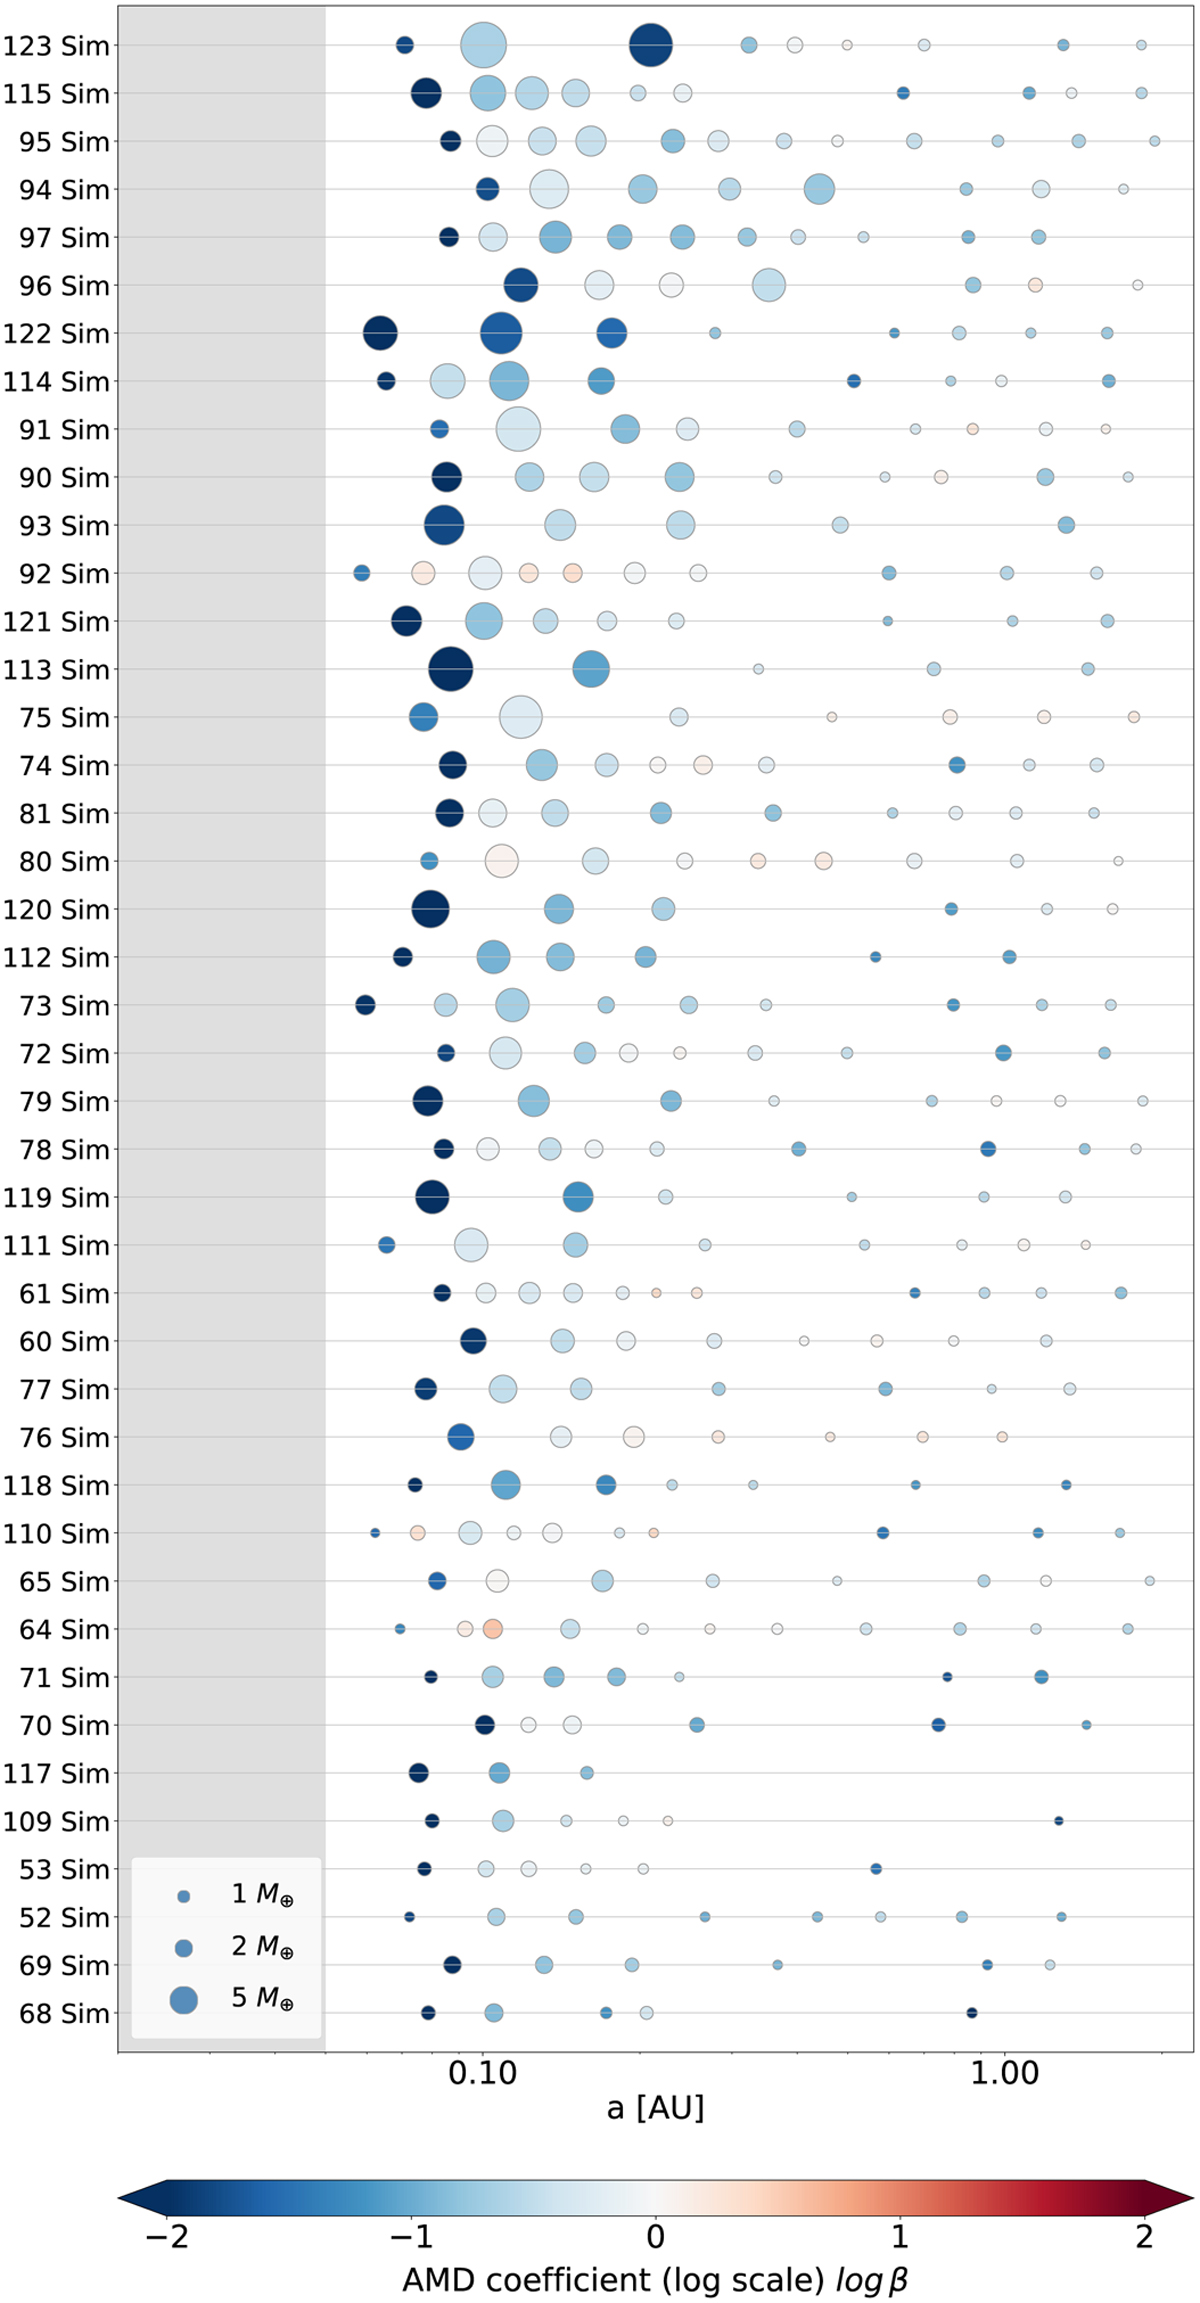
Fig. 23
Download original image
AMD stability of the simulated systems. Each planet is represented by a circle, the size of which is proportional to the mass of the planet. The color represents the AMD stability coefficient, β (in log scale), of the inner pair associated with the planet. The innermost planet is represented by the AMD stability coefficient associated with the star. Numbers in the simulation names (y-axis) are random, but the systems are ordered by their initial disk mass value, which decreases from top to bottom. Systems starting with the disk mass = 5 M⊕ contain only one or two very small planets and are therefore not included in the plot (but they are AMD-stable).
Current usage metrics show cumulative count of Article Views (full-text article views including HTML views, PDF and ePub downloads, according to the available data) and Abstracts Views on Vision4Press platform.
Data correspond to usage on the plateform after 2015. The current usage metrics is available 48-96 hours after online publication and is updated daily on week days.
Initial download of the metrics may take a while.