Fig. 20
Download original image
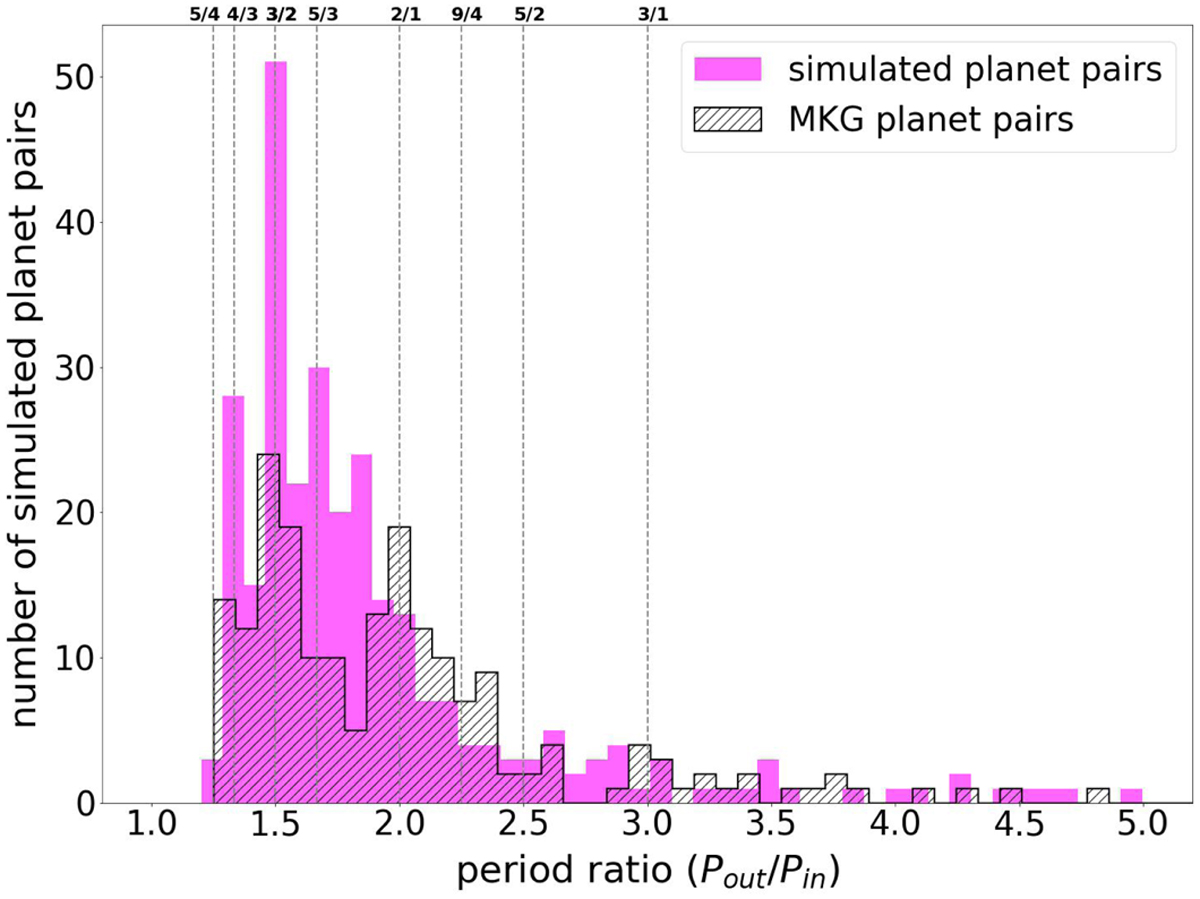
Period ratios Pout/Pin of all pairs of subsequent planets for our simulated population of planets (in magenta) compared to the period ratios of the pairs from our MKG sample (see the hatched area of the histogram). Main orbital resonances between the planet pairs are indicated by the dashed gray lines and identified by the fractions at the top of the plot.
Current usage metrics show cumulative count of Article Views (full-text article views including HTML views, PDF and ePub downloads, according to the available data) and Abstracts Views on Vision4Press platform.
Data correspond to usage on the plateform after 2015. The current usage metrics is available 48-96 hours after online publication and is updated daily on week days.
Initial download of the metrics may take a while.