Fig. 14
Download original image
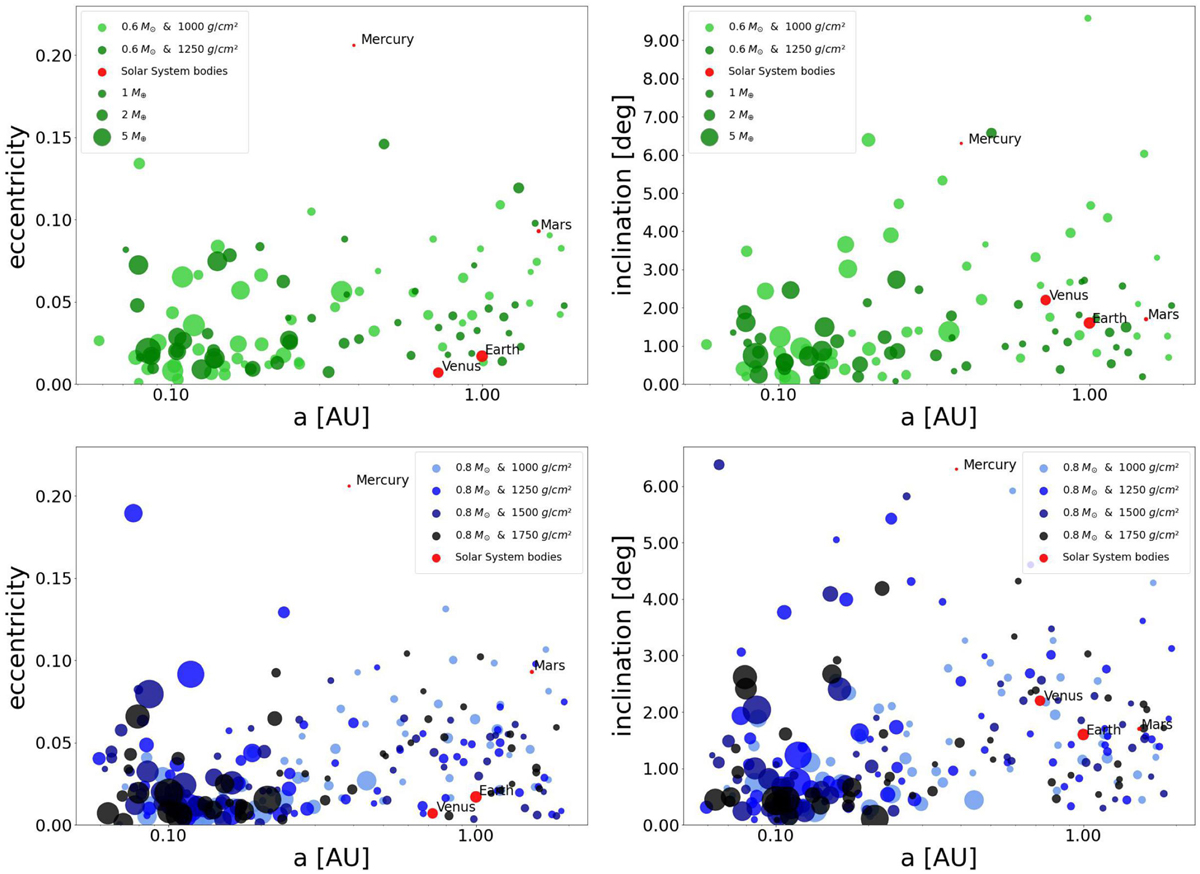
Eccentricities (on the left) and inclinations (on the right) of the simulated planets around a 0.6 M⊙ star (in green; the top row) and a 0.8 M⊙ star (in blue; the bottom row) versus their semimajor axes. Different shades of green and blue denote the different initial values of the gas surface densities at 1 AU, i.e., 1000, 1250, 1500, and 1750 g cm−2; the higher initial density, the darker color of the circles. The point size indicates the masses in M⊕ of the formed planets. Eccentricities and inclinations of terrestrial Solar System planets are displayed for comparison (in red); their sizes are enlarged by a factor of 2 for better visualization.
Current usage metrics show cumulative count of Article Views (full-text article views including HTML views, PDF and ePub downloads, according to the available data) and Abstracts Views on Vision4Press platform.
Data correspond to usage on the plateform after 2015. The current usage metrics is available 48-96 hours after online publication and is updated daily on week days.
Initial download of the metrics may take a while.