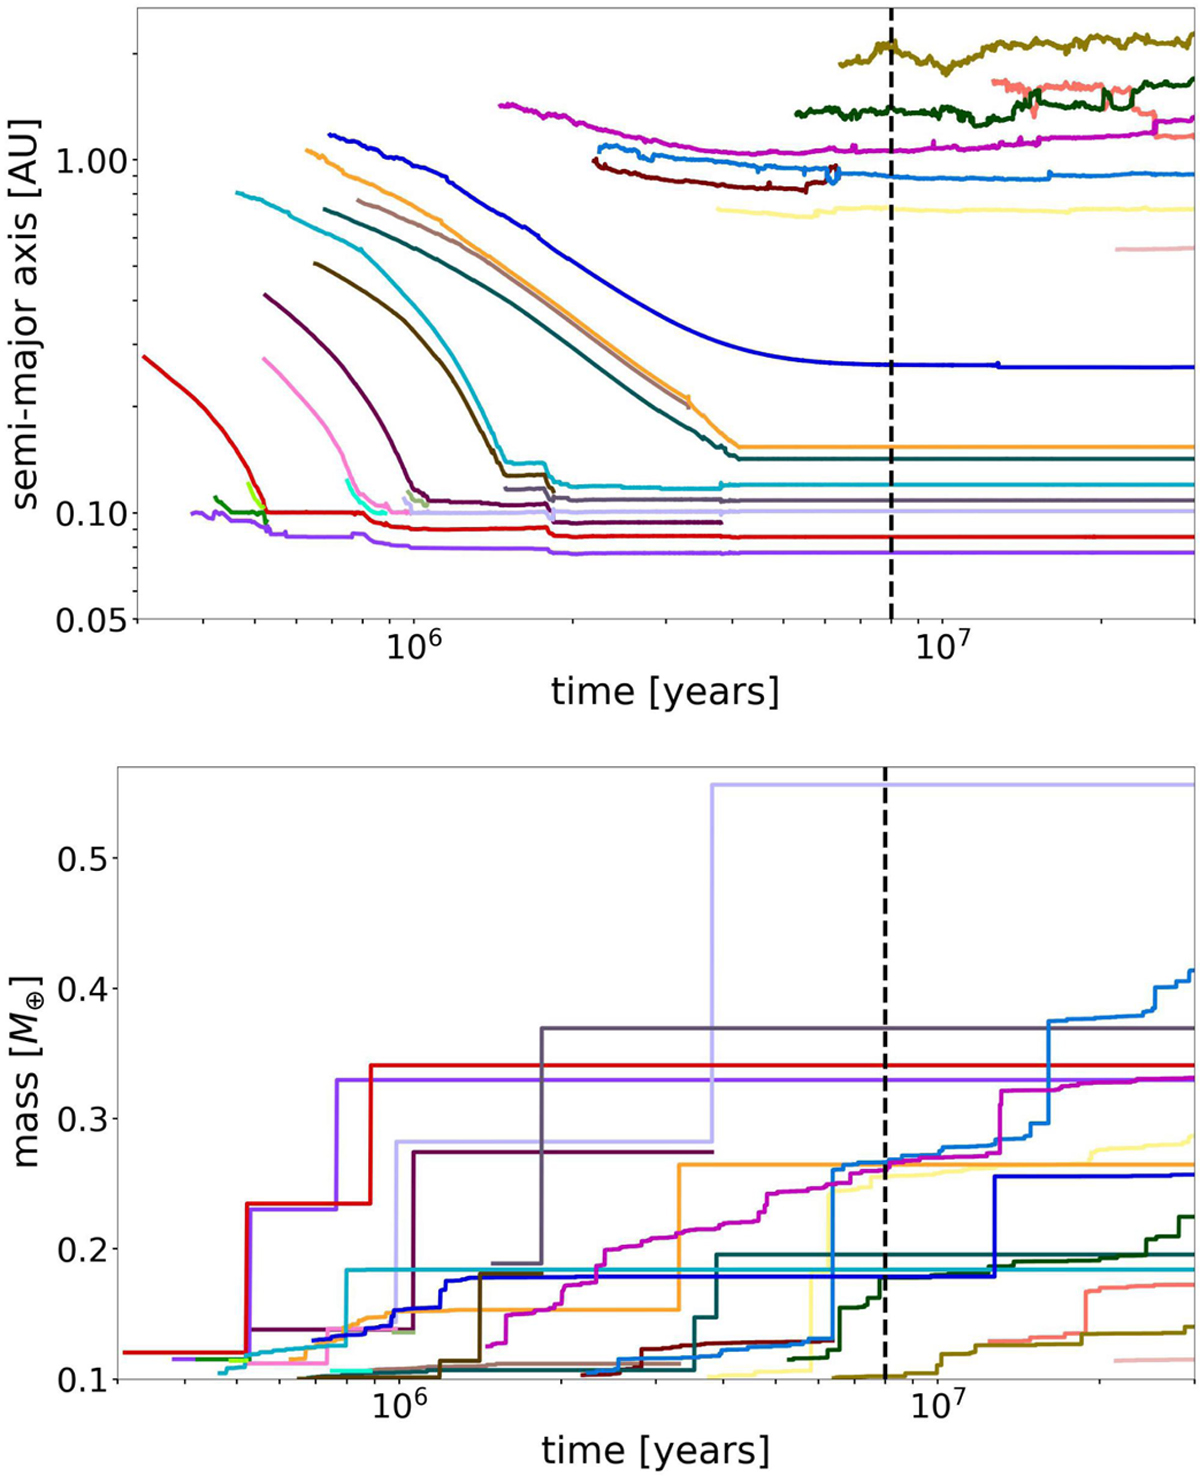
Fig. 13
Download original image
Dynamical evolution of one of the single planet systems. The plots show the temporal evolution (30 Myr) of planetary bodies, specifically their semimajor axes and masses. Only bodies with masses > 0.1 M⊕ are displayed. Each line color represents an individual object; the same object is indicated by the same color in both plots. The dashed black line shows the estimated time of the gas dissipation at ~8 Myr. Only one object (in light purple) has a mass above 0. 5 M⊕ and is classified as a planet in this study.
Current usage metrics show cumulative count of Article Views (full-text article views including HTML views, PDF and ePub downloads, according to the available data) and Abstracts Views on Vision4Press platform.
Data correspond to usage on the plateform after 2015. The current usage metrics is available 48-96 hours after online publication and is updated daily on week days.
Initial download of the metrics may take a while.