Open Access
Fig. 12
Download original image
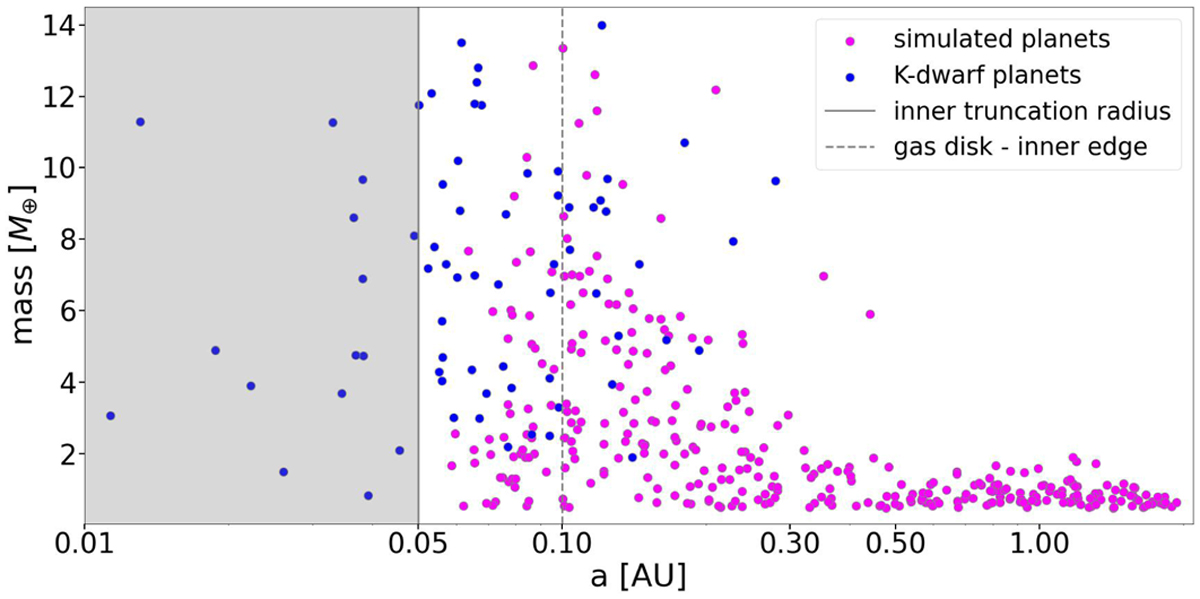
Mass-distance relationship for the planetary systems. Magenta and blue circles respectively represent our simulated sample and the observed sample around K dwarfs. The gray zone is the region inside the inner truncation radius, and the dashed gray line shows the inner edge of the gas disk.
Current usage metrics show cumulative count of Article Views (full-text article views including HTML views, PDF and ePub downloads, according to the available data) and Abstracts Views on Vision4Press platform.
Data correspond to usage on the plateform after 2015. The current usage metrics is available 48-96 hours after online publication and is updated daily on week days.
Initial download of the metrics may take a while.