Fig. 7
Download original image
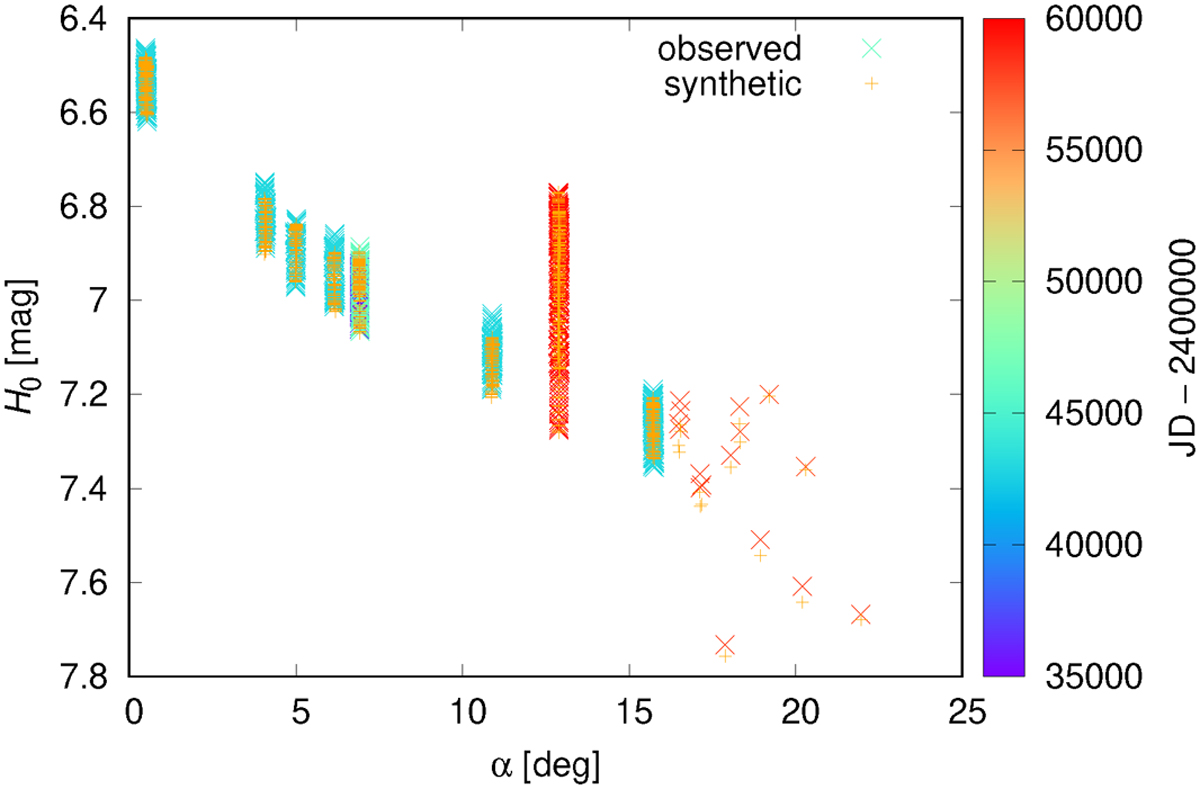
Phase curve of the (22) Kalliope and Linus system. The reduced brightness H0 versus the phase angle α is plotted. Calibrated photometry from Gehrels & Owings (1962), Scaltriti et al. (1978), Surdej et al. (1986), this work, and the Gaia DR3 was used. The observed curve (×) is plotted in colour (according to the Julian date) and the synthetic (+) is in yellow. The range of α is from 2 to 22°. There is an unreduced ![]() and nlc = 1892, with systematics up to 0.05 mag. The ‘scatter’ of points is mostly due to the light curve, which is fitted by our model. Our measurements with α ~ 13°, taken in the Cousins R band, are in agreement with our model (0.001 mag).
and nlc = 1892, with systematics up to 0.05 mag. The ‘scatter’ of points is mostly due to the light curve, which is fitted by our model. Our measurements with α ~ 13°, taken in the Cousins R band, are in agreement with our model (0.001 mag).
Current usage metrics show cumulative count of Article Views (full-text article views including HTML views, PDF and ePub downloads, according to the available data) and Abstracts Views on Vision4Press platform.
Data correspond to usage on the plateform after 2015. The current usage metrics is available 48-96 hours after online publication and is updated daily on week days.
Initial download of the metrics may take a while.