Fig. A.3
Download original image
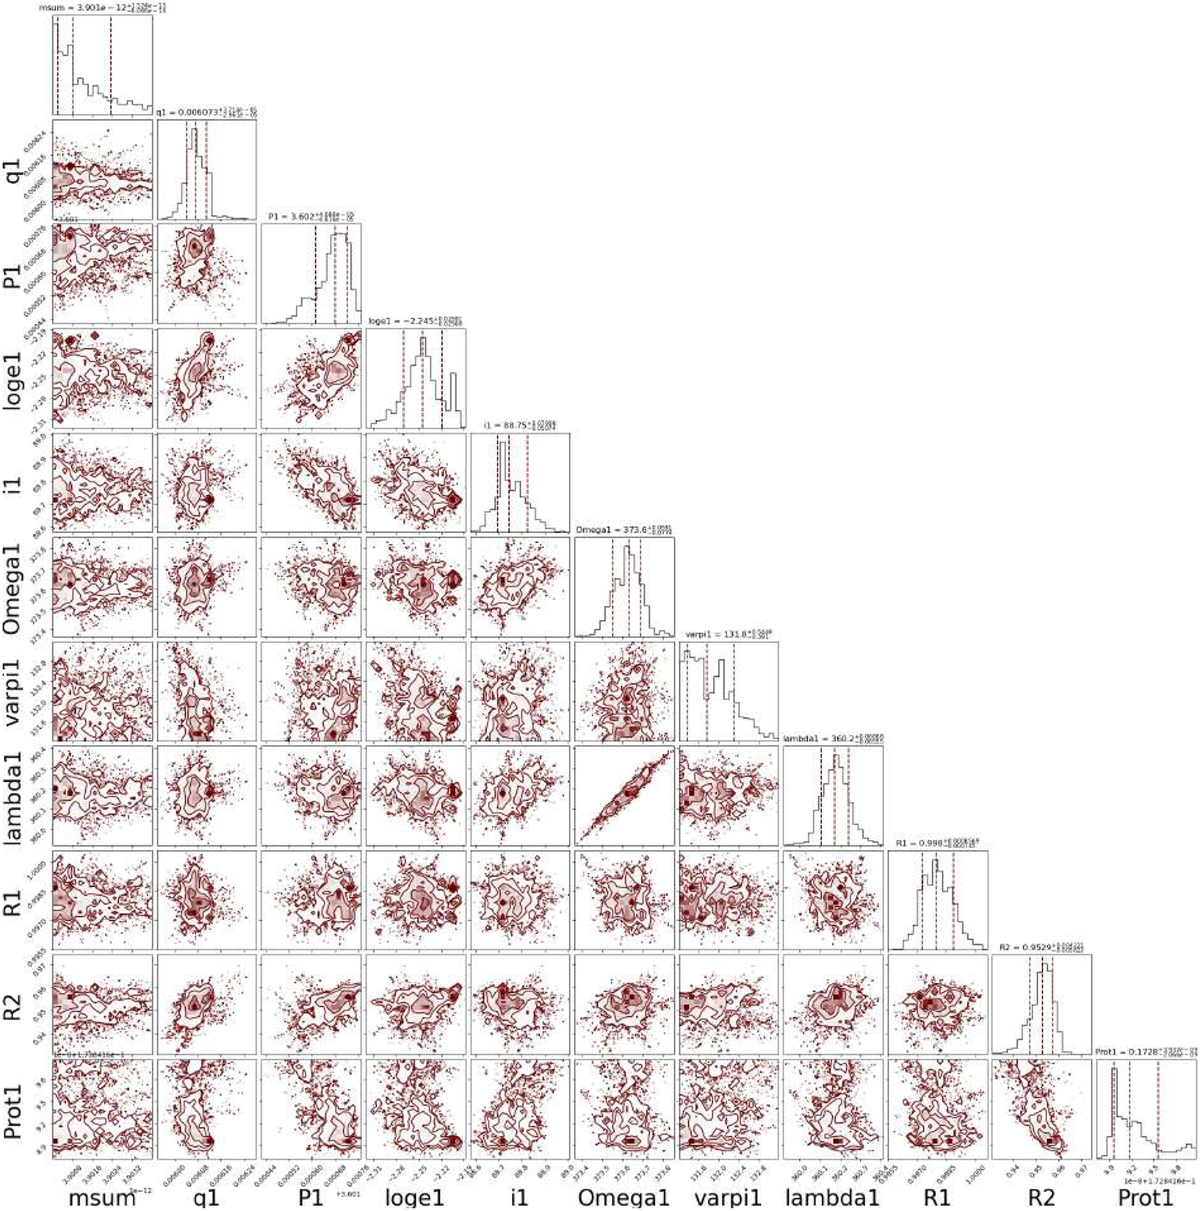
MCMC simulation for the model with χ2 = 6695 (from Table 2). Distributions of all parameters, corresponding to local uncertainties, and correlations of all pairs of parameters is plotted as a standard ‘corner’. The order of 22 parameters is as follows (↓, →): msum, q1, P1, log e1, i1, Ω1, ϖ1, λ1, R1, R2, Prot1, ∆t1, С20,1, lpole1, bpole1, ϕ01, Aw1, Aw2, B0, h, g, and ![]() . The mean value is seen in the respective histogram. The number of walkers was set to 64. The whole chain contained 2400 samples, the burn-in phase took up to 1000 of them. In the course of iterations, walkers may drift away from the initial local minimum, because walkers perform also low-probability steps to higher χ2 values, which may sometimes result in systematic shifts of (some of) the parameters. In this case, the MCMC was also affected by a change in the weights (wsky = 10, wao = 0.1), which prevents the MCMC from fitting the systematics on the light curve at expense of the PISCO astrometric dataset.
. The mean value is seen in the respective histogram. The number of walkers was set to 64. The whole chain contained 2400 samples, the burn-in phase took up to 1000 of them. In the course of iterations, walkers may drift away from the initial local minimum, because walkers perform also low-probability steps to higher χ2 values, which may sometimes result in systematic shifts of (some of) the parameters. In this case, the MCMC was also affected by a change in the weights (wsky = 10, wao = 0.1), which prevents the MCMC from fitting the systematics on the light curve at expense of the PISCO astrometric dataset.
Current usage metrics show cumulative count of Article Views (full-text article views including HTML views, PDF and ePub downloads, according to the available data) and Abstracts Views on Vision4Press platform.
Data correspond to usage on the plateform after 2015. The current usage metrics is available 48-96 hours after online publication and is updated daily on week days.
Initial download of the metrics may take a while.