Fig. 10
Download original image
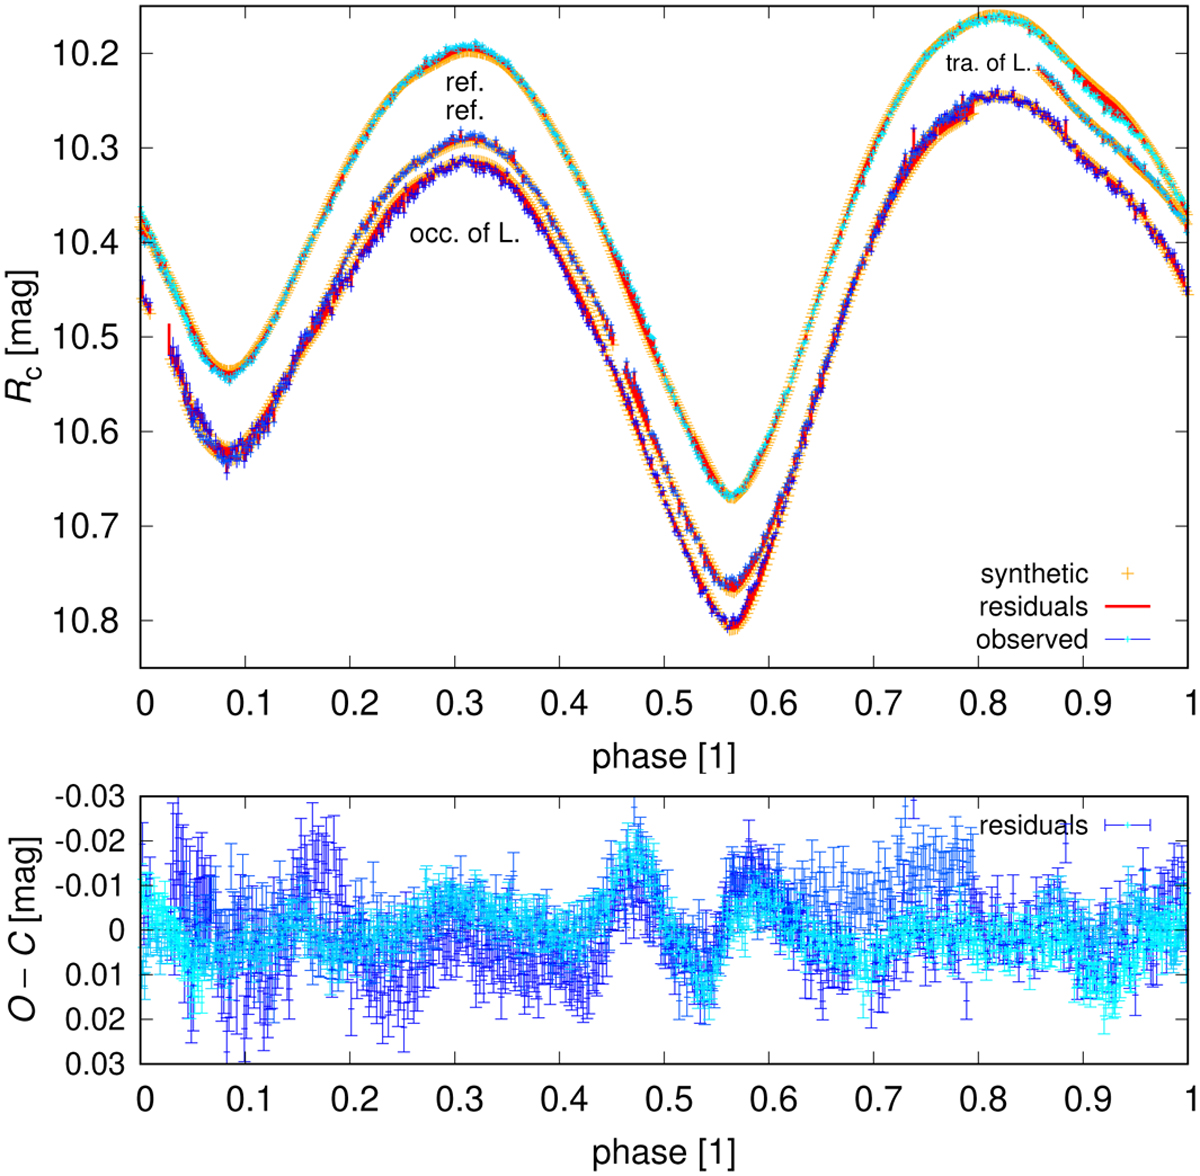
Phased light curves for the short-arc, astrometric + photometric model (top). It shows the first occultation of Linus and the second transit of Linus, together with the reference light curves. The observed light curve is plotted as blue (with error bars), the synthetic as yellow, the residuals as red. The shades of blue correspond to the Julian date. The drop in brightness is up to 0.05 mag. Both the amplitude and duration of the events are in agreement. For comparison, we also plot the difference О − С (bottom). Remaining systematics occur on all light curves; so they must be related to the shape, not the occultations. The contribution to χ2 is ![]() , nlc = 1829.
, nlc = 1829.
Current usage metrics show cumulative count of Article Views (full-text article views including HTML views, PDF and ePub downloads, according to the available data) and Abstracts Views on Vision4Press platform.
Data correspond to usage on the plateform after 2015. The current usage metrics is available 48-96 hours after online publication and is updated daily on week days.
Initial download of the metrics may take a while.