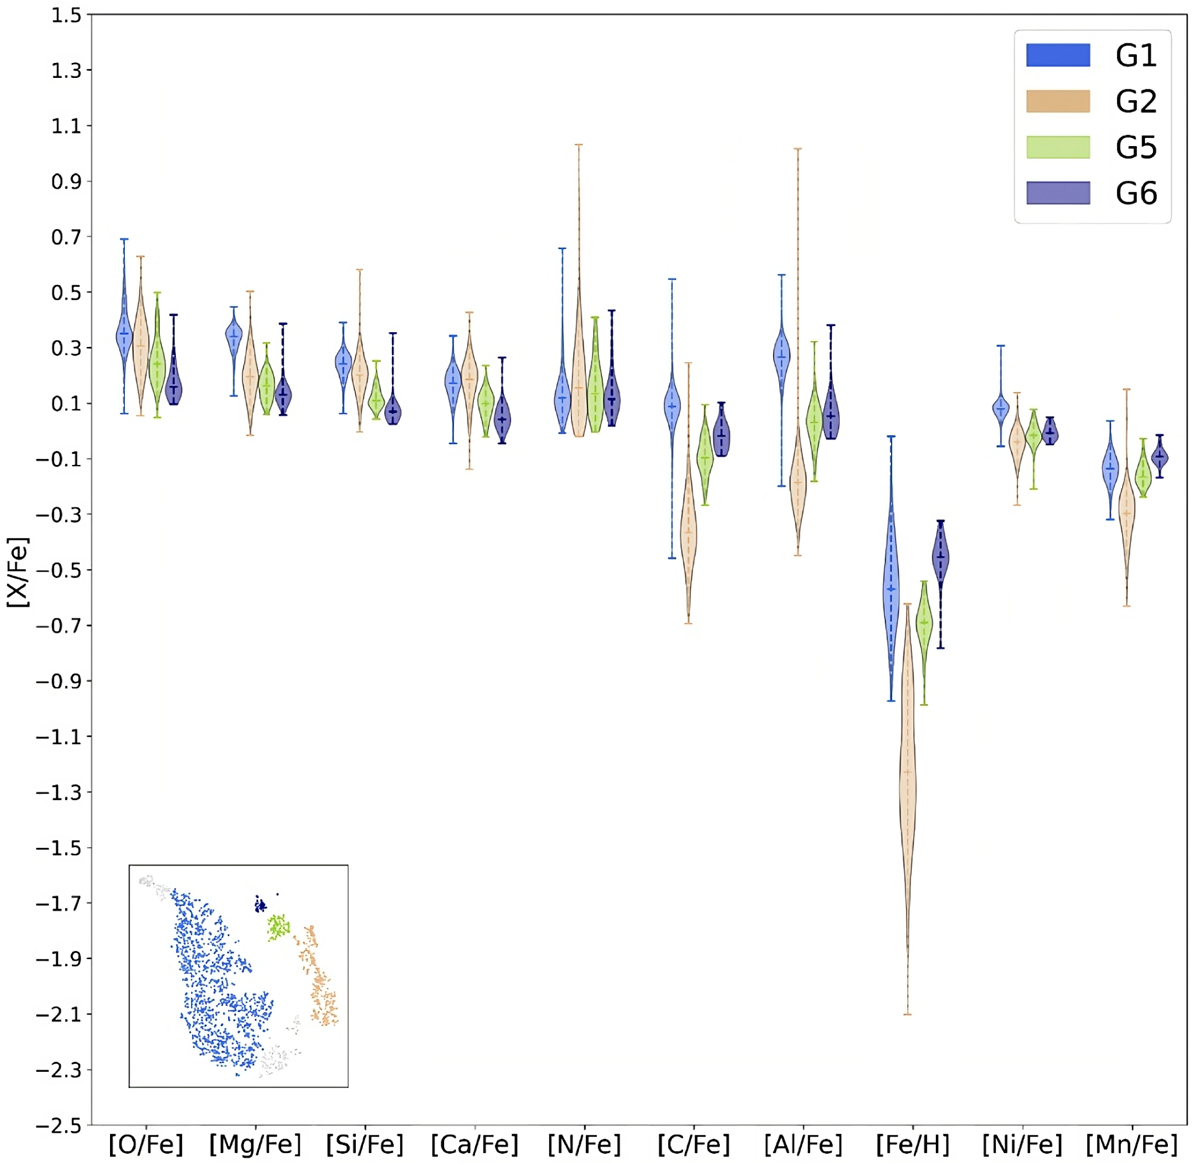
Fig. 3.
Download original image
Comparison of Groups G1 (Splash), G2 (GSE), G5 (Galileo 5), and G6 (Galileo 6), in each of the chemical abundances used in this work, displayed in the form of a violin plot. A common trend in the compared abundances for the α elements can be seen, as well as in the iron-peak elements. The observed distributions demonstrate that each group is different from the others in at least one chemical abundance.
Current usage metrics show cumulative count of Article Views (full-text article views including HTML views, PDF and ePub downloads, according to the available data) and Abstracts Views on Vision4Press platform.
Data correspond to usage on the plateform after 2015. The current usage metrics is available 48-96 hours after online publication and is updated daily on week days.
Initial download of the metrics may take a while.