Open Access
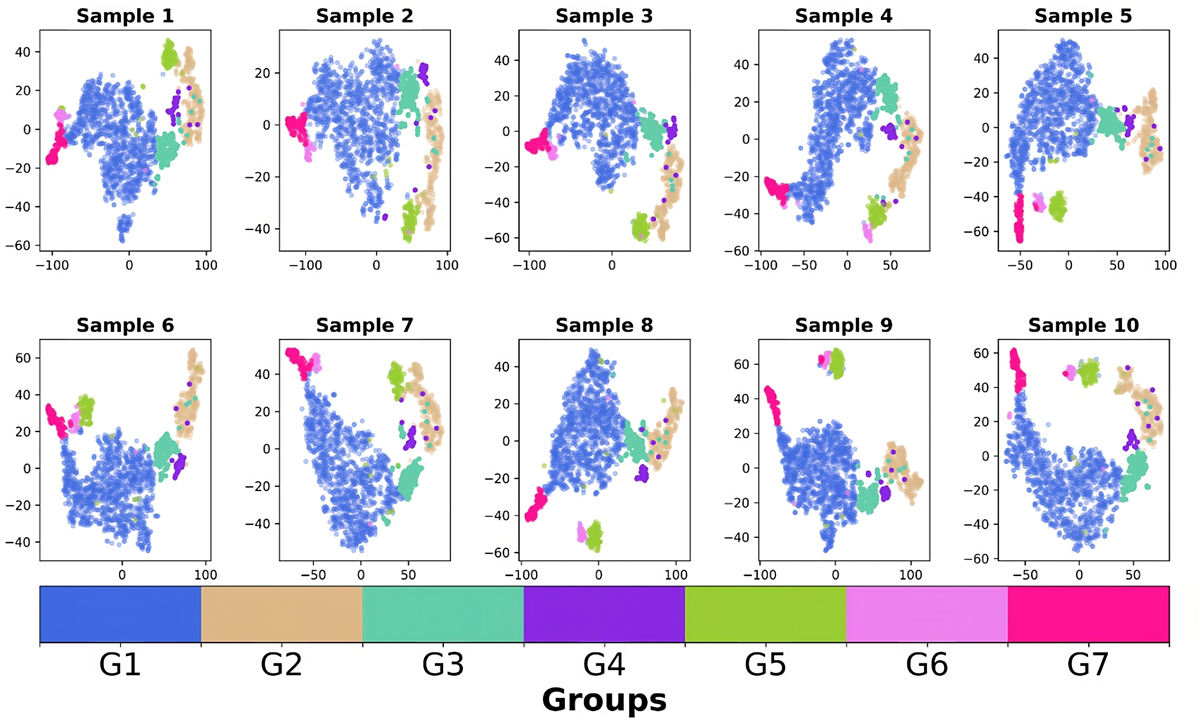
Fig. A.3.
Download original image
Effect of abundance errors on the t-SNE plane. Horizontal and vertical axes correspond to the t-SNE X and Y dimensions, respectively. The Monte-Carlo realizations of the abundances were used as inputs into the t-SNE algorithm to check if the groups selected in Figure 1 were still associated and kept as coherent structures.
Current usage metrics show cumulative count of Article Views (full-text article views including HTML views, PDF and ePub downloads, according to the available data) and Abstracts Views on Vision4Press platform.
Data correspond to usage on the plateform after 2015. The current usage metrics is available 48-96 hours after online publication and is updated daily on week days.
Initial download of the metrics may take a while.