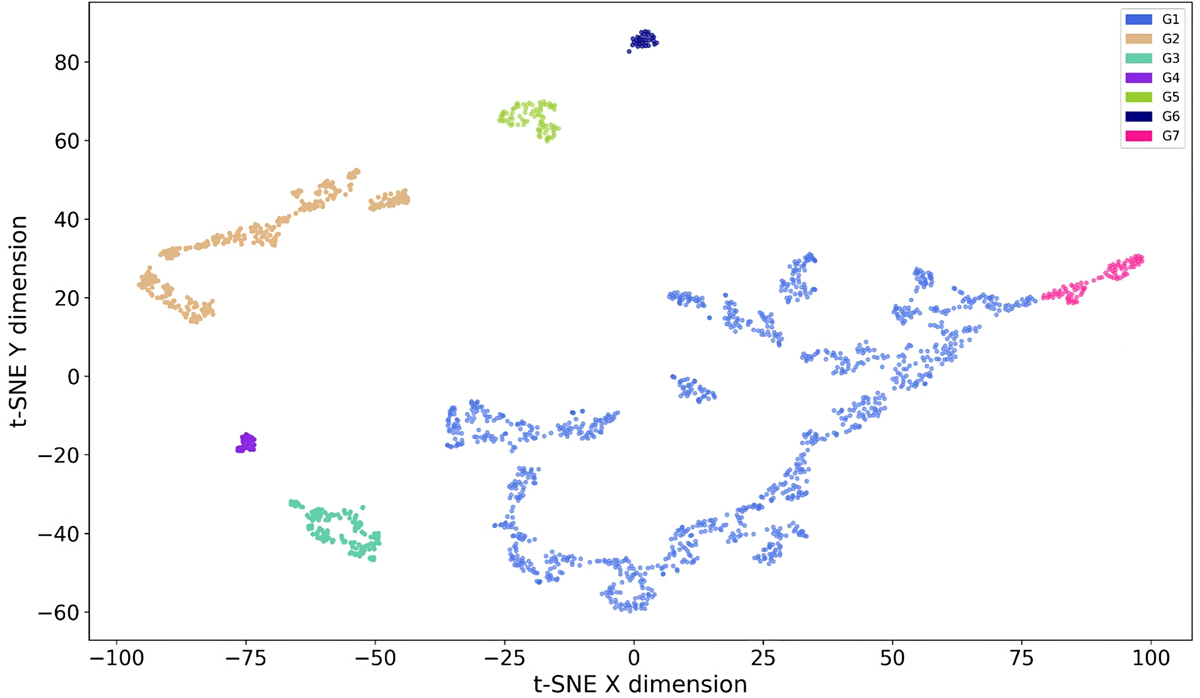
Fig. A.2.
Download original image
Iterated t-SNE plane. The values of t-SNE X and t-SNE Y from Figure 1 in the central panel were fed as additional data to another run of t-SNE, so as to check if adjacent groups in the original t-SNE plane were separated or not, and to determine where the borders occur. It is important to notice how the overall shape is kept, but in fact in this case t-SNE flipped the orientation of the points in the plane.
Current usage metrics show cumulative count of Article Views (full-text article views including HTML views, PDF and ePub downloads, according to the available data) and Abstracts Views on Vision4Press platform.
Data correspond to usage on the plateform after 2015. The current usage metrics is available 48-96 hours after online publication and is updated daily on week days.
Initial download of the metrics may take a while.