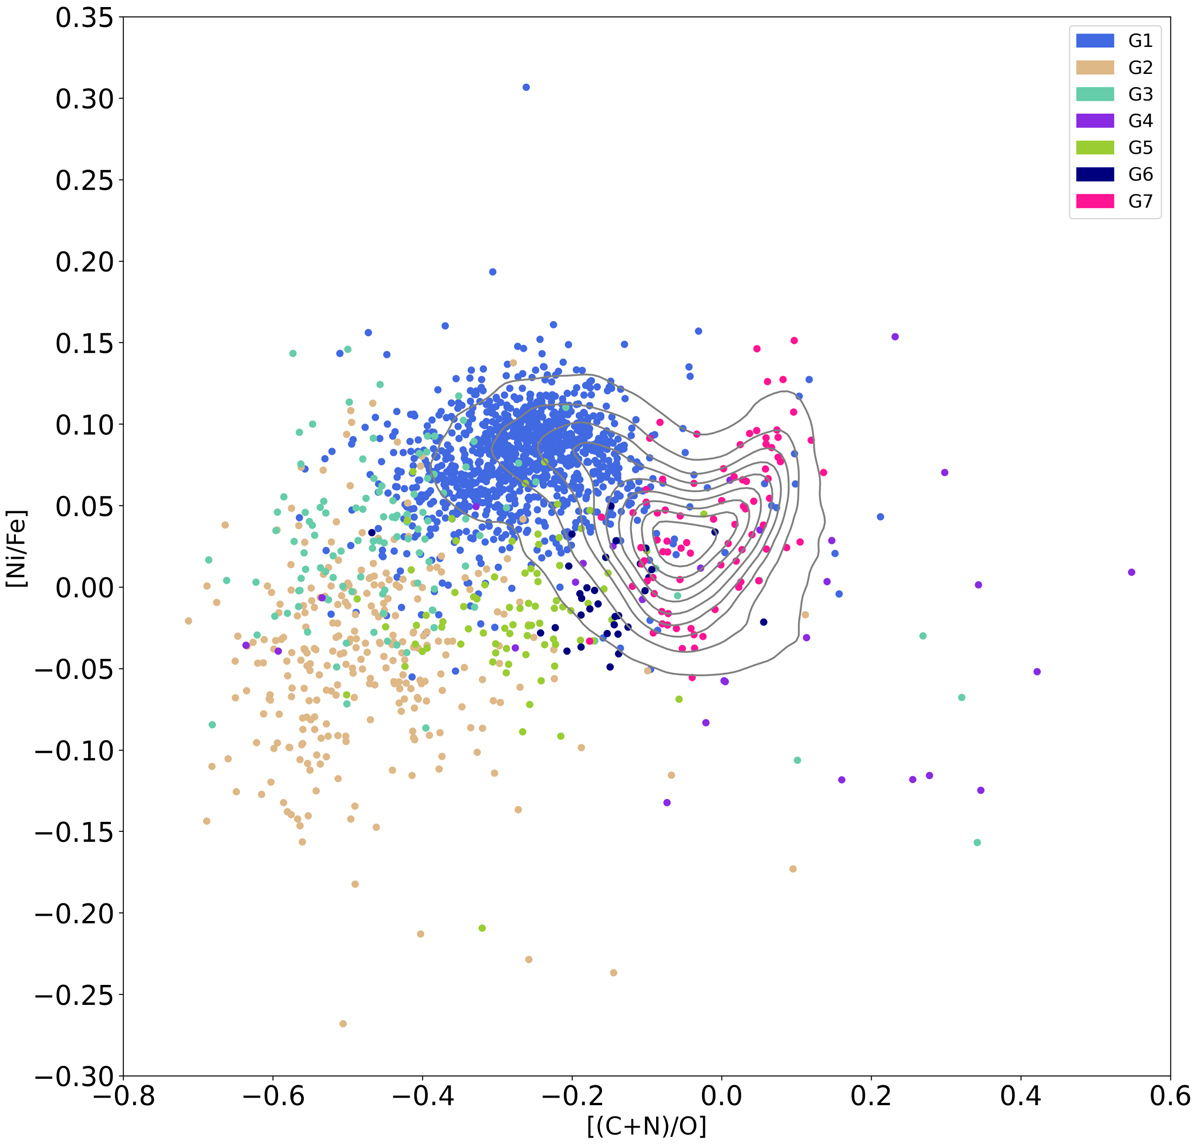
Fig. 10.
Download original image
[Ni/Fe] versus [(C+N)/O] plot, color-coded for each detected group. A kernel density estimation (KDE) plot of MW disk stars is shown with gray curves. These were selected from APOGEE DR17 following the same quality criteria as our halo stars, and Vϕ ≥ 100 km s−1. We note that [Ni/Fe] < 0 and [(C+N)/0] < −0.2 have been linked to ex situ stars. In this work, G2 (Splash) and G5 (Galileo 5) fall in the locus of accreted stars. G6 (Galileo 6) overlaps with the thick-disk population.
Current usage metrics show cumulative count of Article Views (full-text article views including HTML views, PDF and ePub downloads, according to the available data) and Abstracts Views on Vision4Press platform.
Data correspond to usage on the plateform after 2015. The current usage metrics is available 48-96 hours after online publication and is updated daily on week days.
Initial download of the metrics may take a while.