Fig. 3.
Download original image
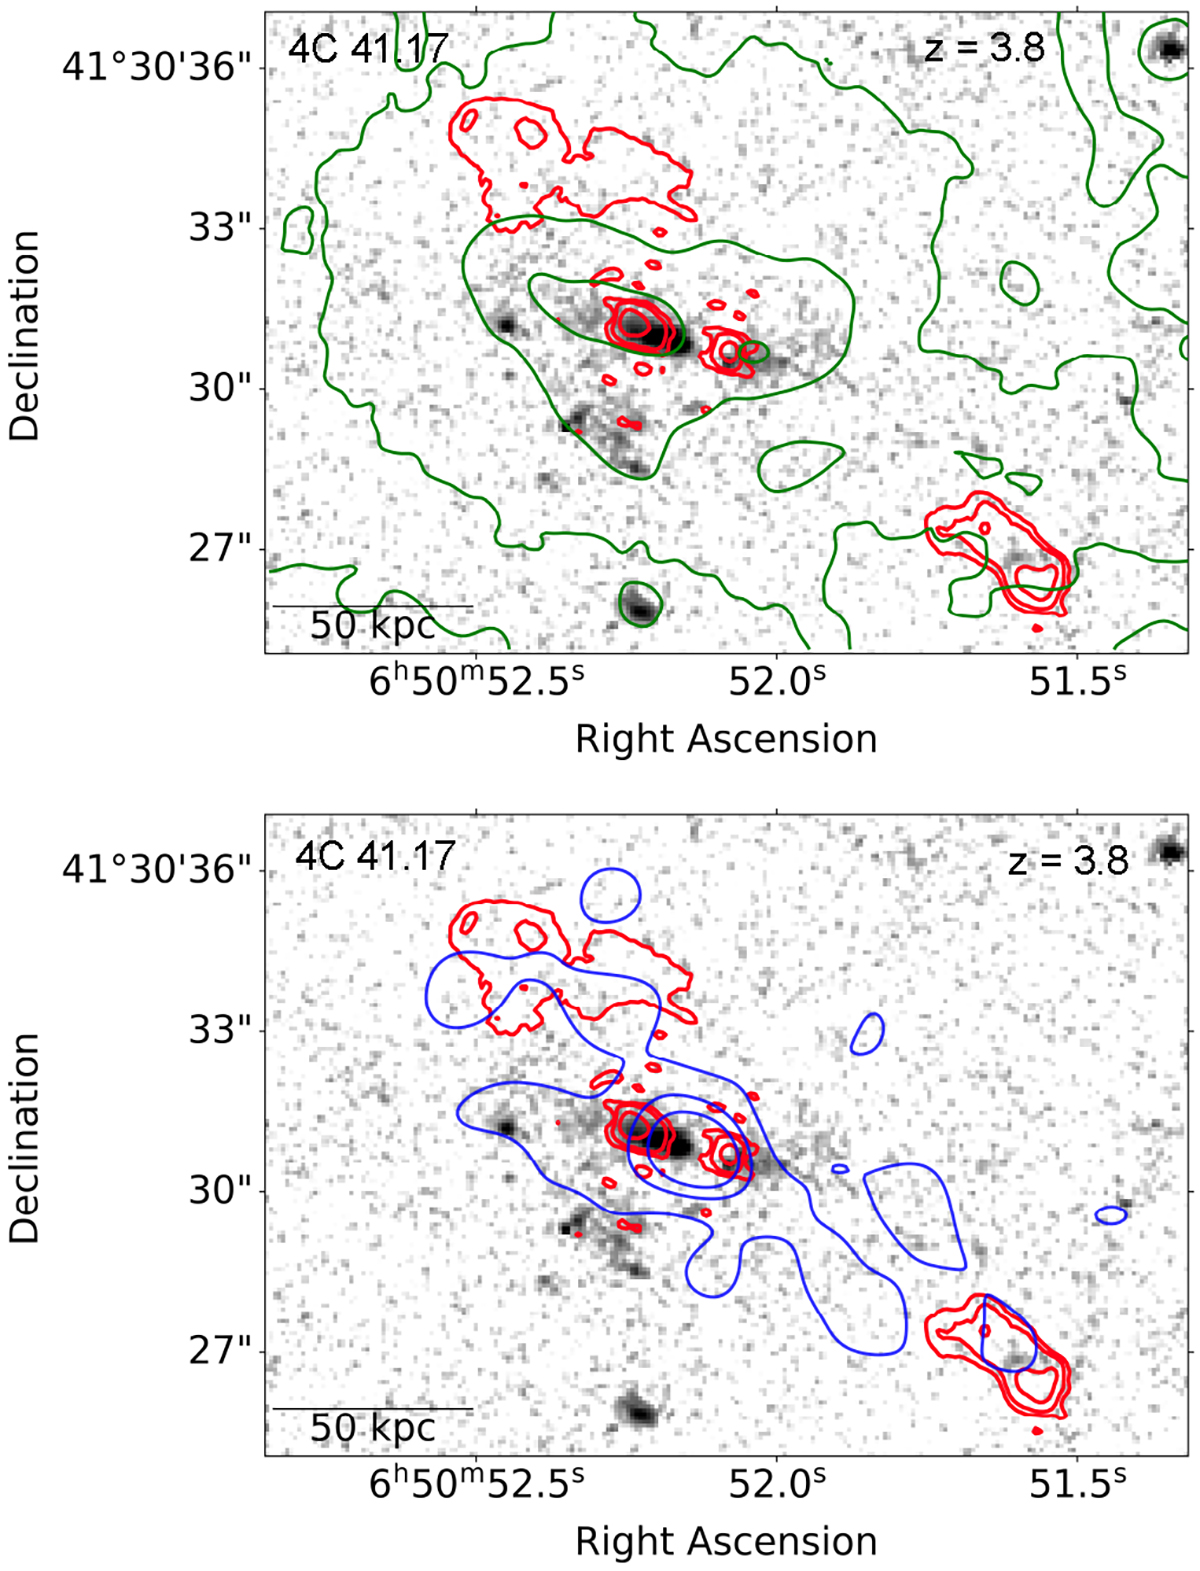
Overlay of ILT 144 MHz radio image for 4C 41.17 at z = 3.8 (red contours) above 3σ noise, superimposed on the HST continuum image (4 h exposure through the F702W filter of WFPC2 Bicknell et al. 2000). The green contours (top panel) add the Keck Lyα distribution observed by Keck (Reuland et al. 2003), and the blue contours (bottom panel) represent the X-ray distribution observed by Chandra (Scharf et al. 2003).
Current usage metrics show cumulative count of Article Views (full-text article views including HTML views, PDF and ePub downloads, according to the available data) and Abstracts Views on Vision4Press platform.
Data correspond to usage on the plateform after 2015. The current usage metrics is available 48-96 hours after online publication and is updated daily on week days.
Initial download of the metrics may take a while.