Open Access
Fig. 10.
Download original image
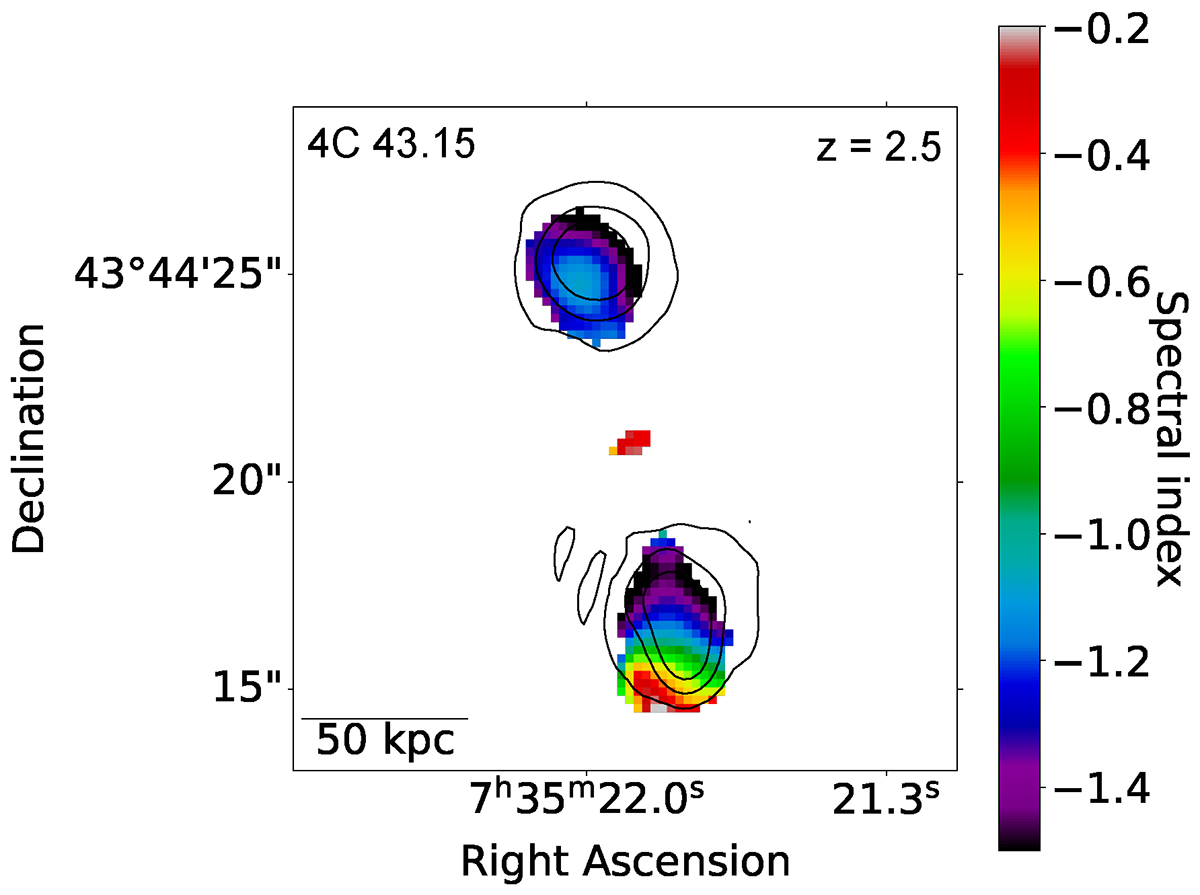
Map of spectral index of 4C 43.15 at z = 2.4 obtained using VLA X-band and the ILT HBA observations. The ILT HBA contours from the smoothed image from Fig. 9 are displayed on top of the spectral index map.
Current usage metrics show cumulative count of Article Views (full-text article views including HTML views, PDF and ePub downloads, according to the available data) and Abstracts Views on Vision4Press platform.
Data correspond to usage on the plateform after 2015. The current usage metrics is available 48-96 hours after online publication and is updated daily on week days.
Initial download of the metrics may take a while.