Fig. 3.

Download original image
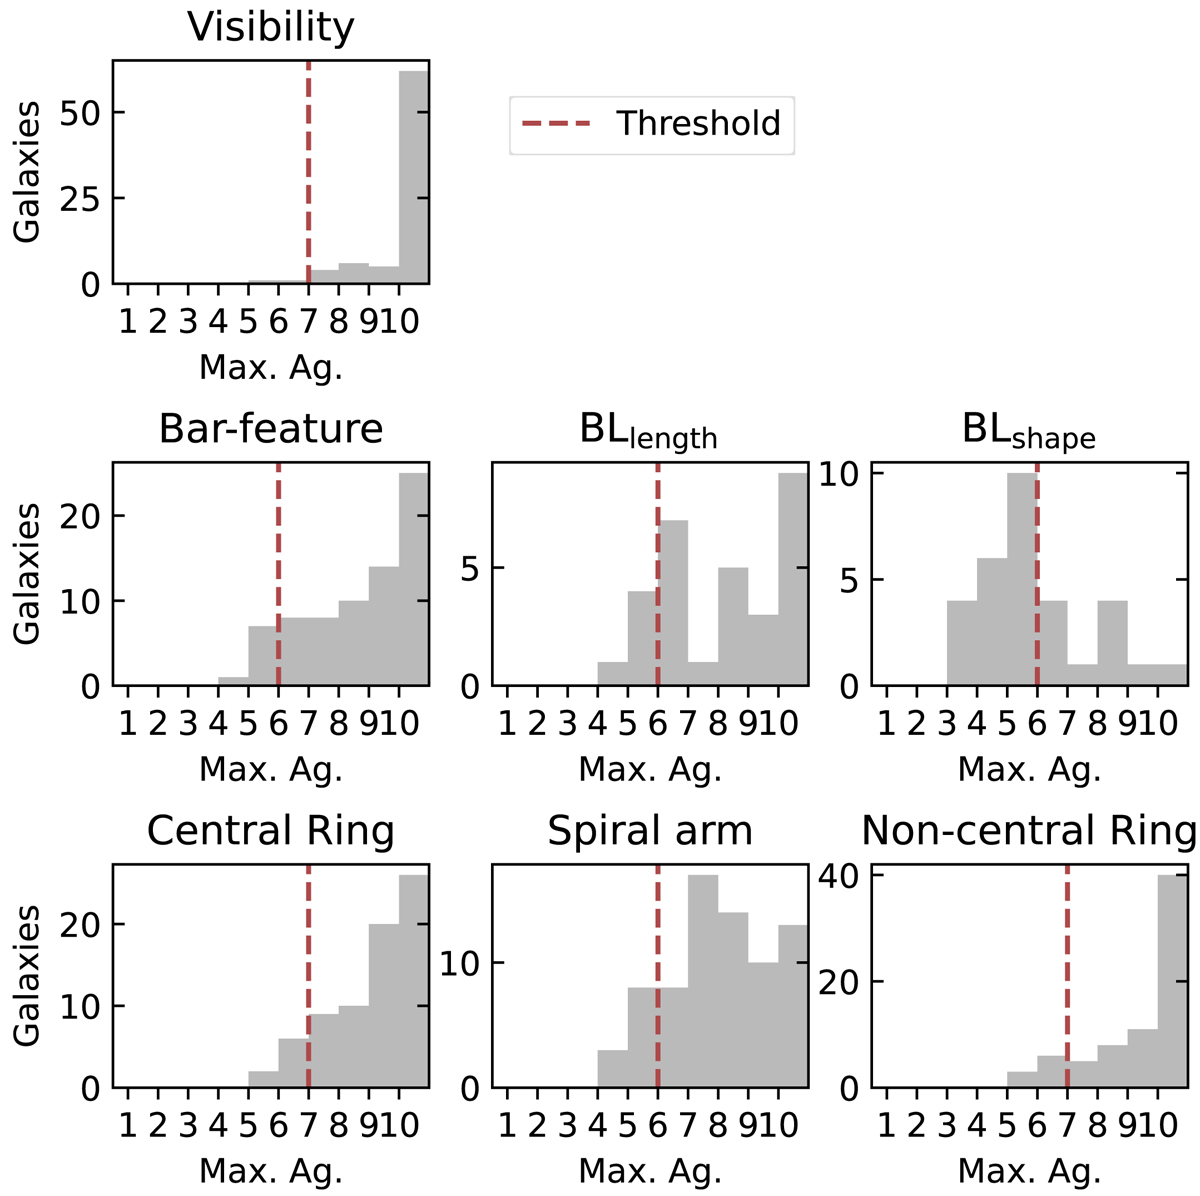
Histogram of maximum agreement per galaxy per class from ten inspectors. From left to right and top to bottom, we show the maximum agreement distribution in the upper panels for: the disk visibility, bar-like features, bar lane lengths (BLlength), bar lane shapes (BLshape), central ring features, spiral arm features, and non-central rings. For each feature, we require a minimum agreement threshold (red dashed line) to consider a classification as reliable. For features with only two options to chose from this is set to 70%, for other features it is 60%.
Current usage metrics show cumulative count of Article Views (full-text article views including HTML views, PDF and ePub downloads, according to the available data) and Abstracts Views on Vision4Press platform.
Data correspond to usage on the plateform after 2015. The current usage metrics is available 48-96 hours after online publication and is updated daily on week days.
Initial download of the metrics may take a while.


