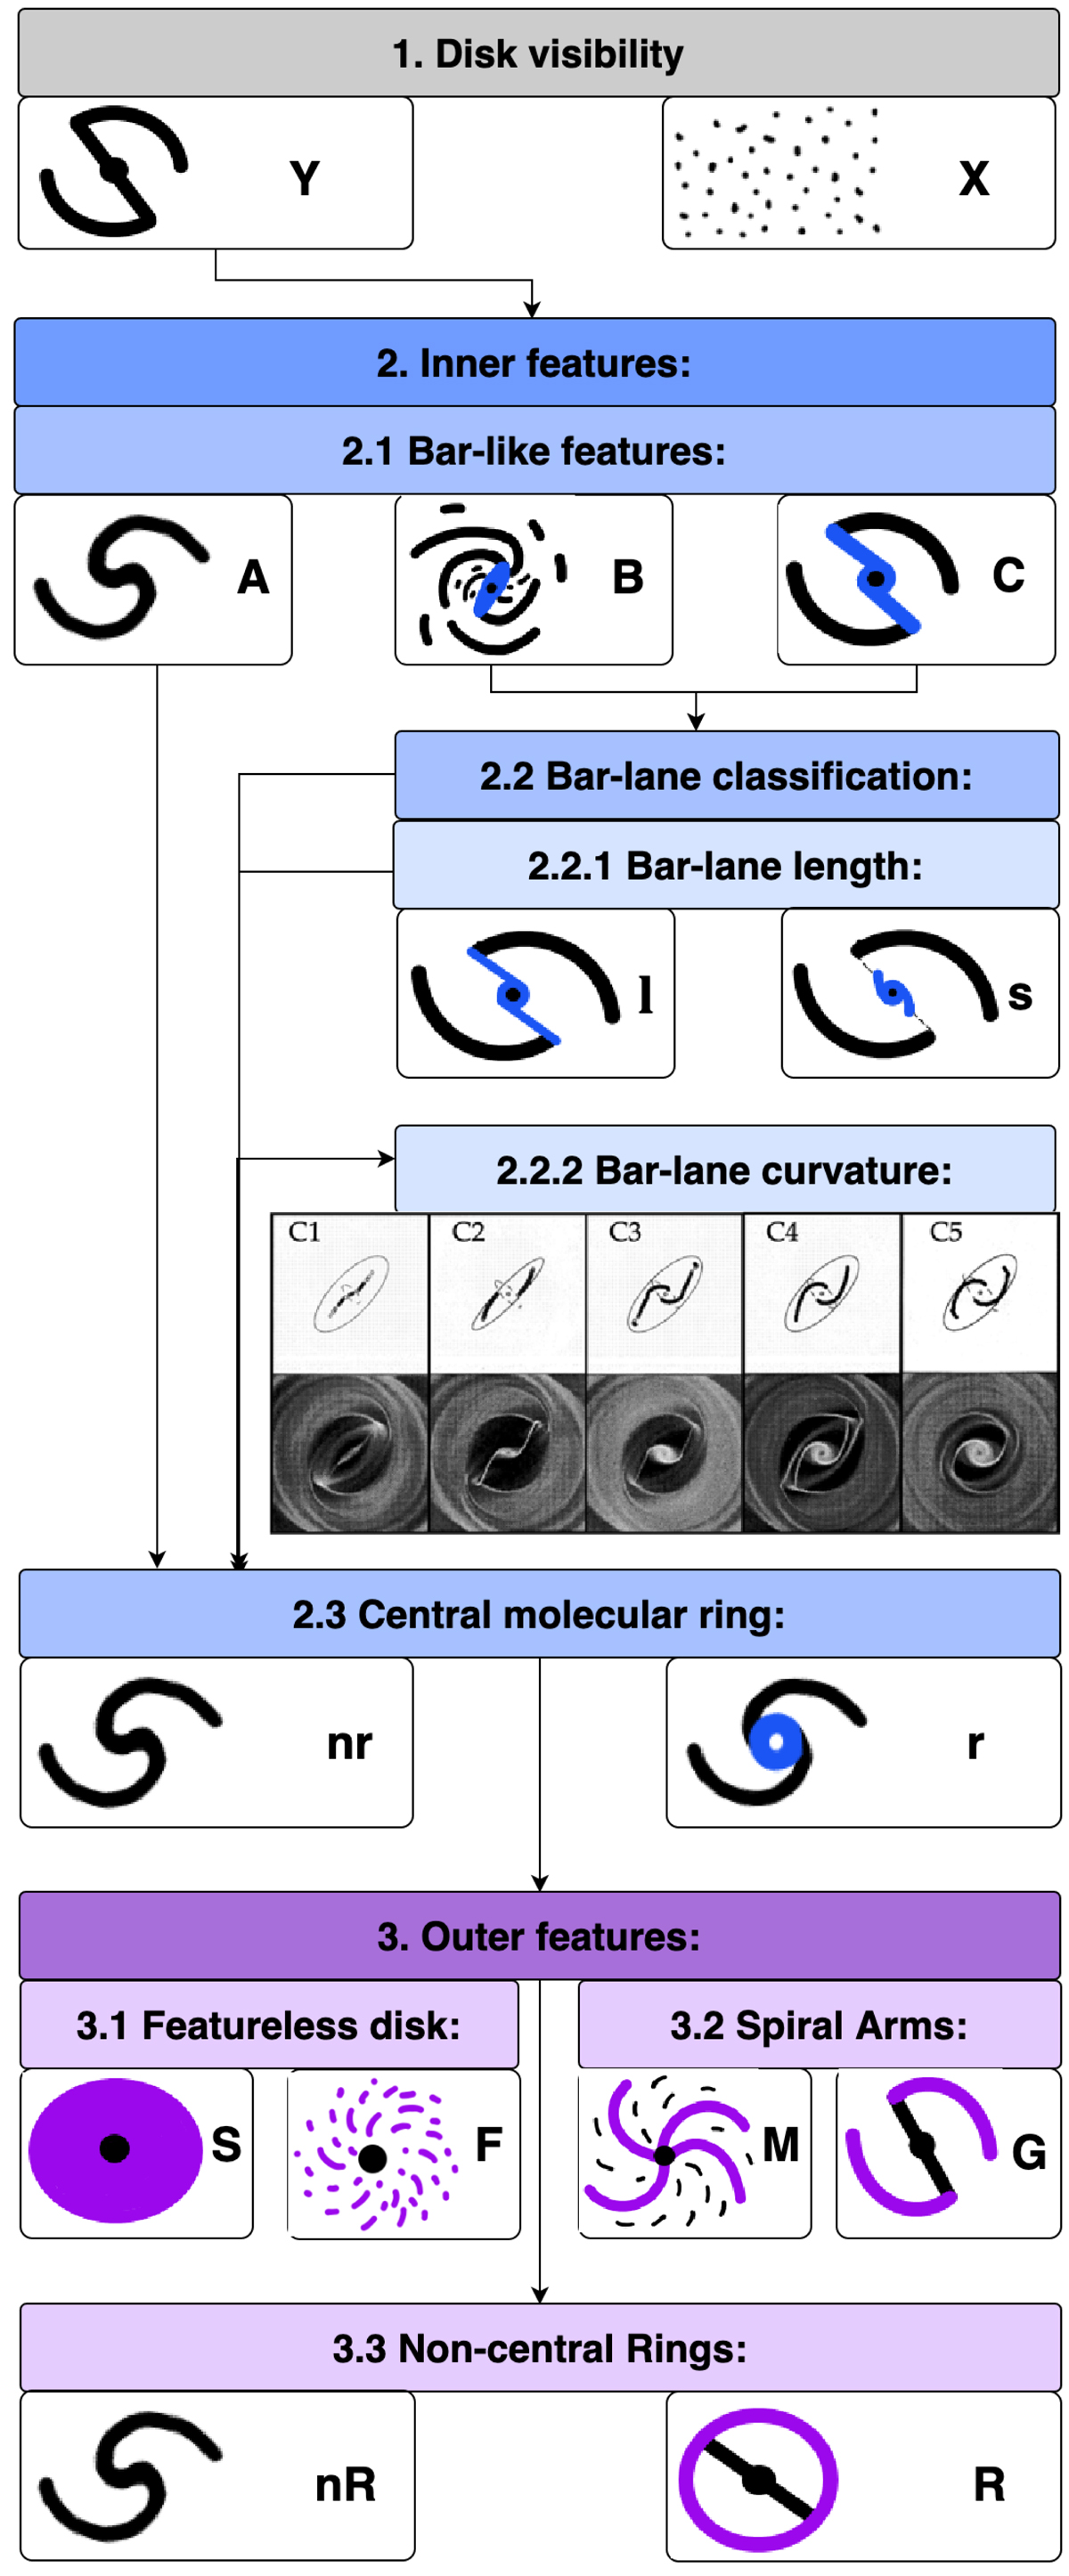
Fig. 2.
Download original image
Flow chart of the morphological classification developed for PHANGS-ALMA CO(2–1) images. Colors represent the three major groups of classes. Arrows indicate dependencies of sub-classes on parent classes and the order of classification. Bar lane curvatures show a selection of peak density maps (top row) and gas distributions (bottom row) of simulated face-on bars (at 45° from the horizontal) from Athanassoula (1992b,a). These image are used as orientation to classify the shape of molecular bar lanes found from class c1 to c5. They were selected to represent physically plausible cases that can be found in our sample and have a visually increasing curvature from c1 to c5.
Current usage metrics show cumulative count of Article Views (full-text article views including HTML views, PDF and ePub downloads, according to the available data) and Abstracts Views on Vision4Press platform.
Data correspond to usage on the plateform after 2015. The current usage metrics is available 48-96 hours after online publication and is updated daily on week days.
Initial download of the metrics may take a while.