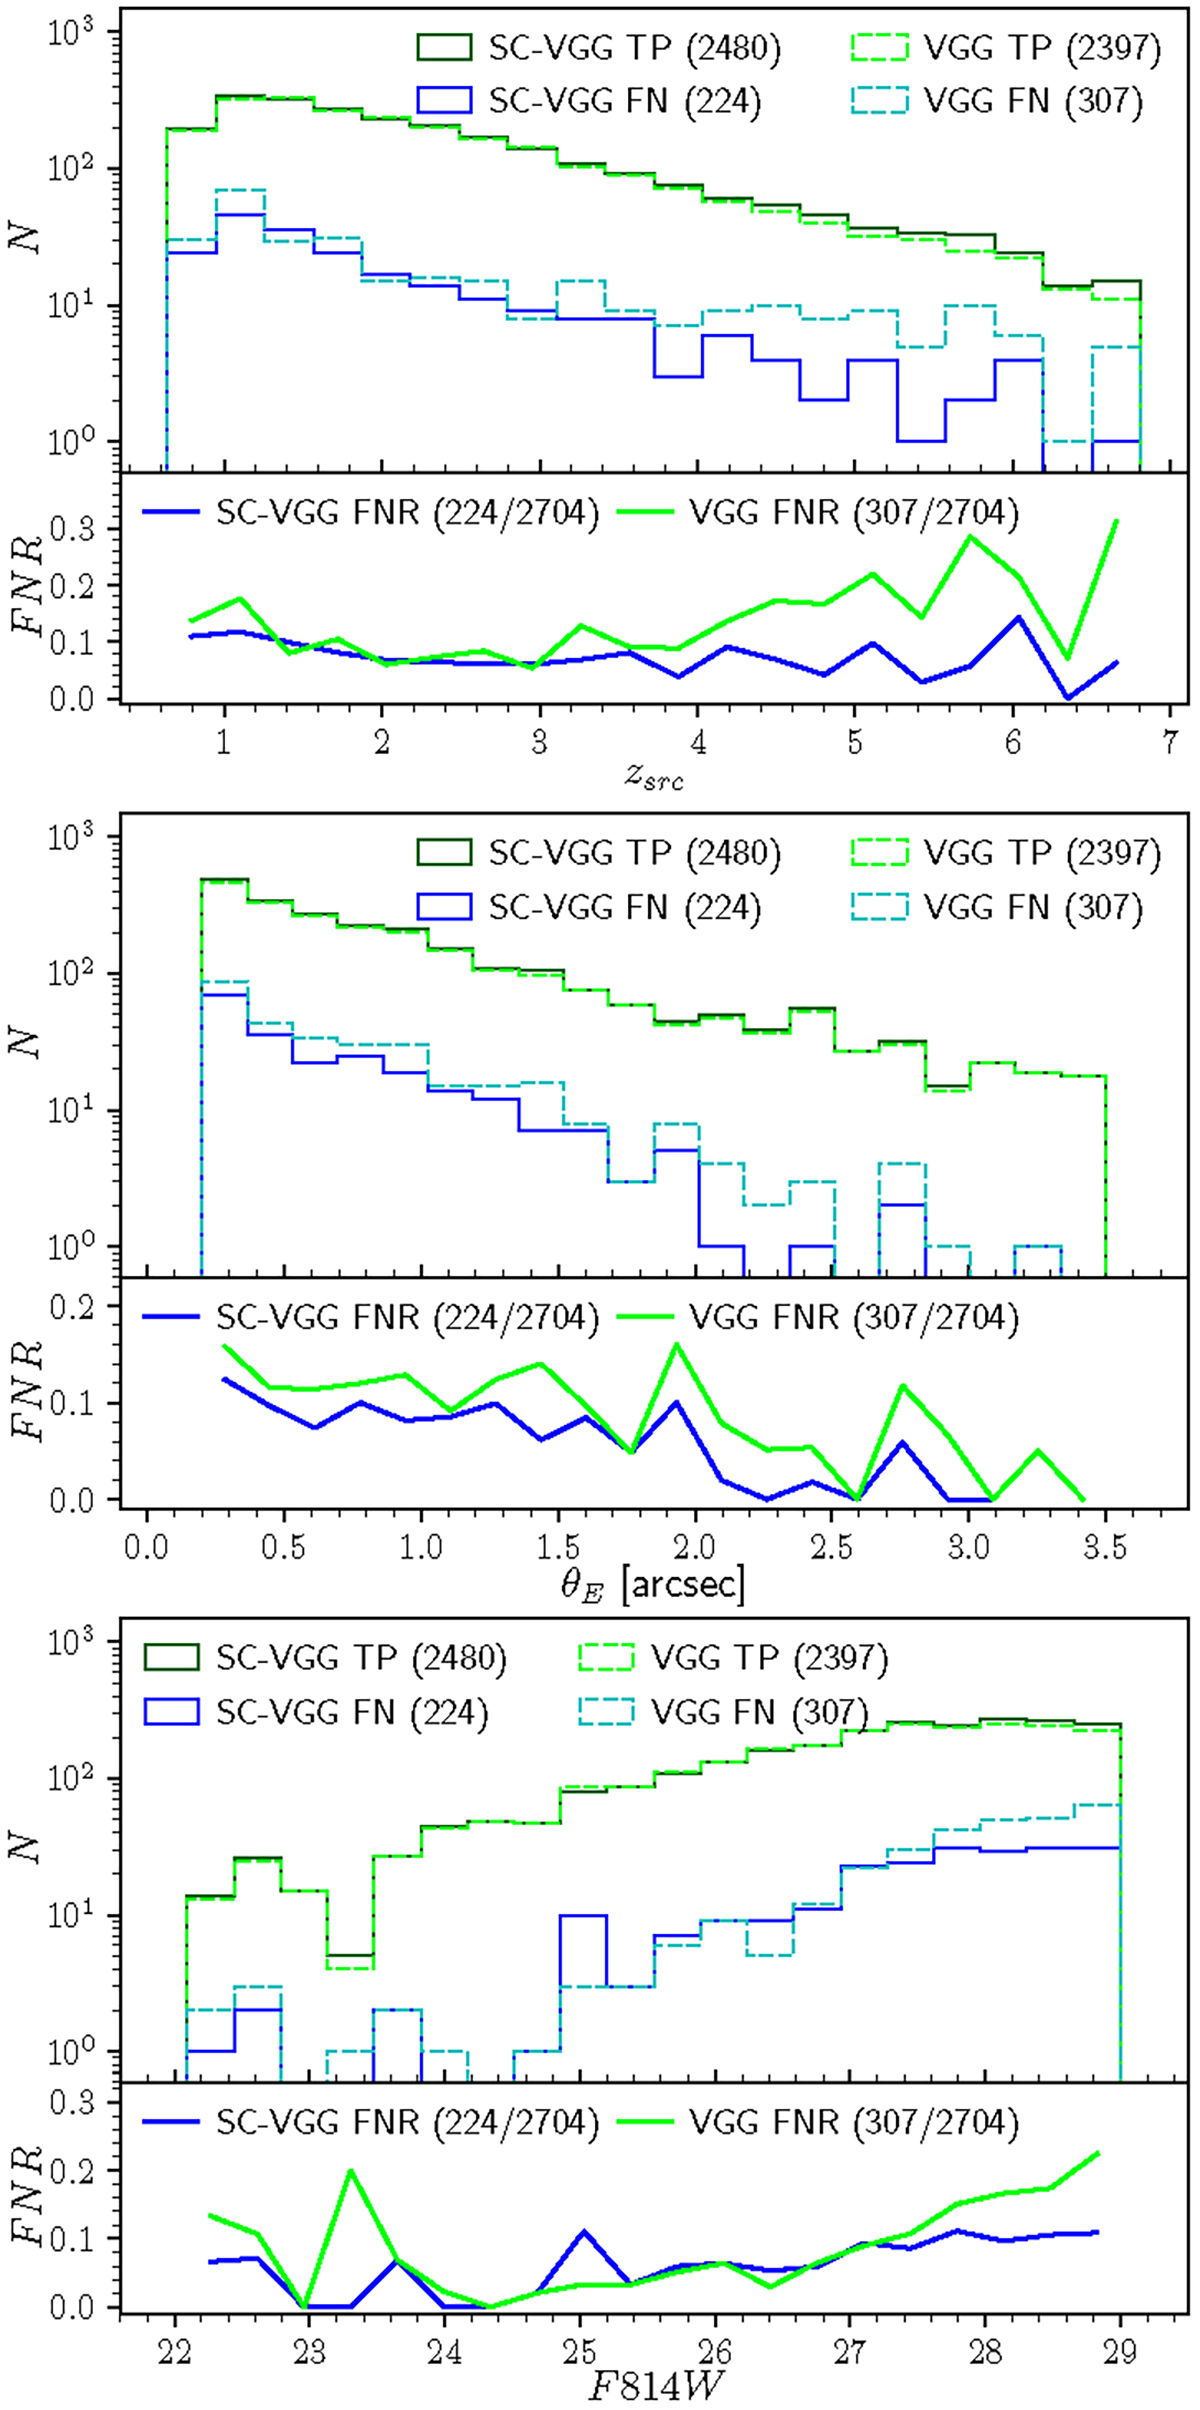
Fig. 9.
Download original image
FN dependences. TPs (green lines) and FNs (blue lines) distributions as a function of source redshift (zsrc, top panel), Einstein radius (θE, middle panel), and source intrinsic F814W magnitude (bottom panel) for the VGG (dashed lines) and SC-VGG (solid lines) models. The corresponding FN ratio is plotted at the bottom of each panel. In all panels, only sources with available and reliable magnitudes are plotted.
Current usage metrics show cumulative count of Article Views (full-text article views including HTML views, PDF and ePub downloads, according to the available data) and Abstracts Views on Vision4Press platform.
Data correspond to usage on the plateform after 2015. The current usage metrics is available 48-96 hours after online publication and is updated daily on week days.
Initial download of the metrics may take a while.