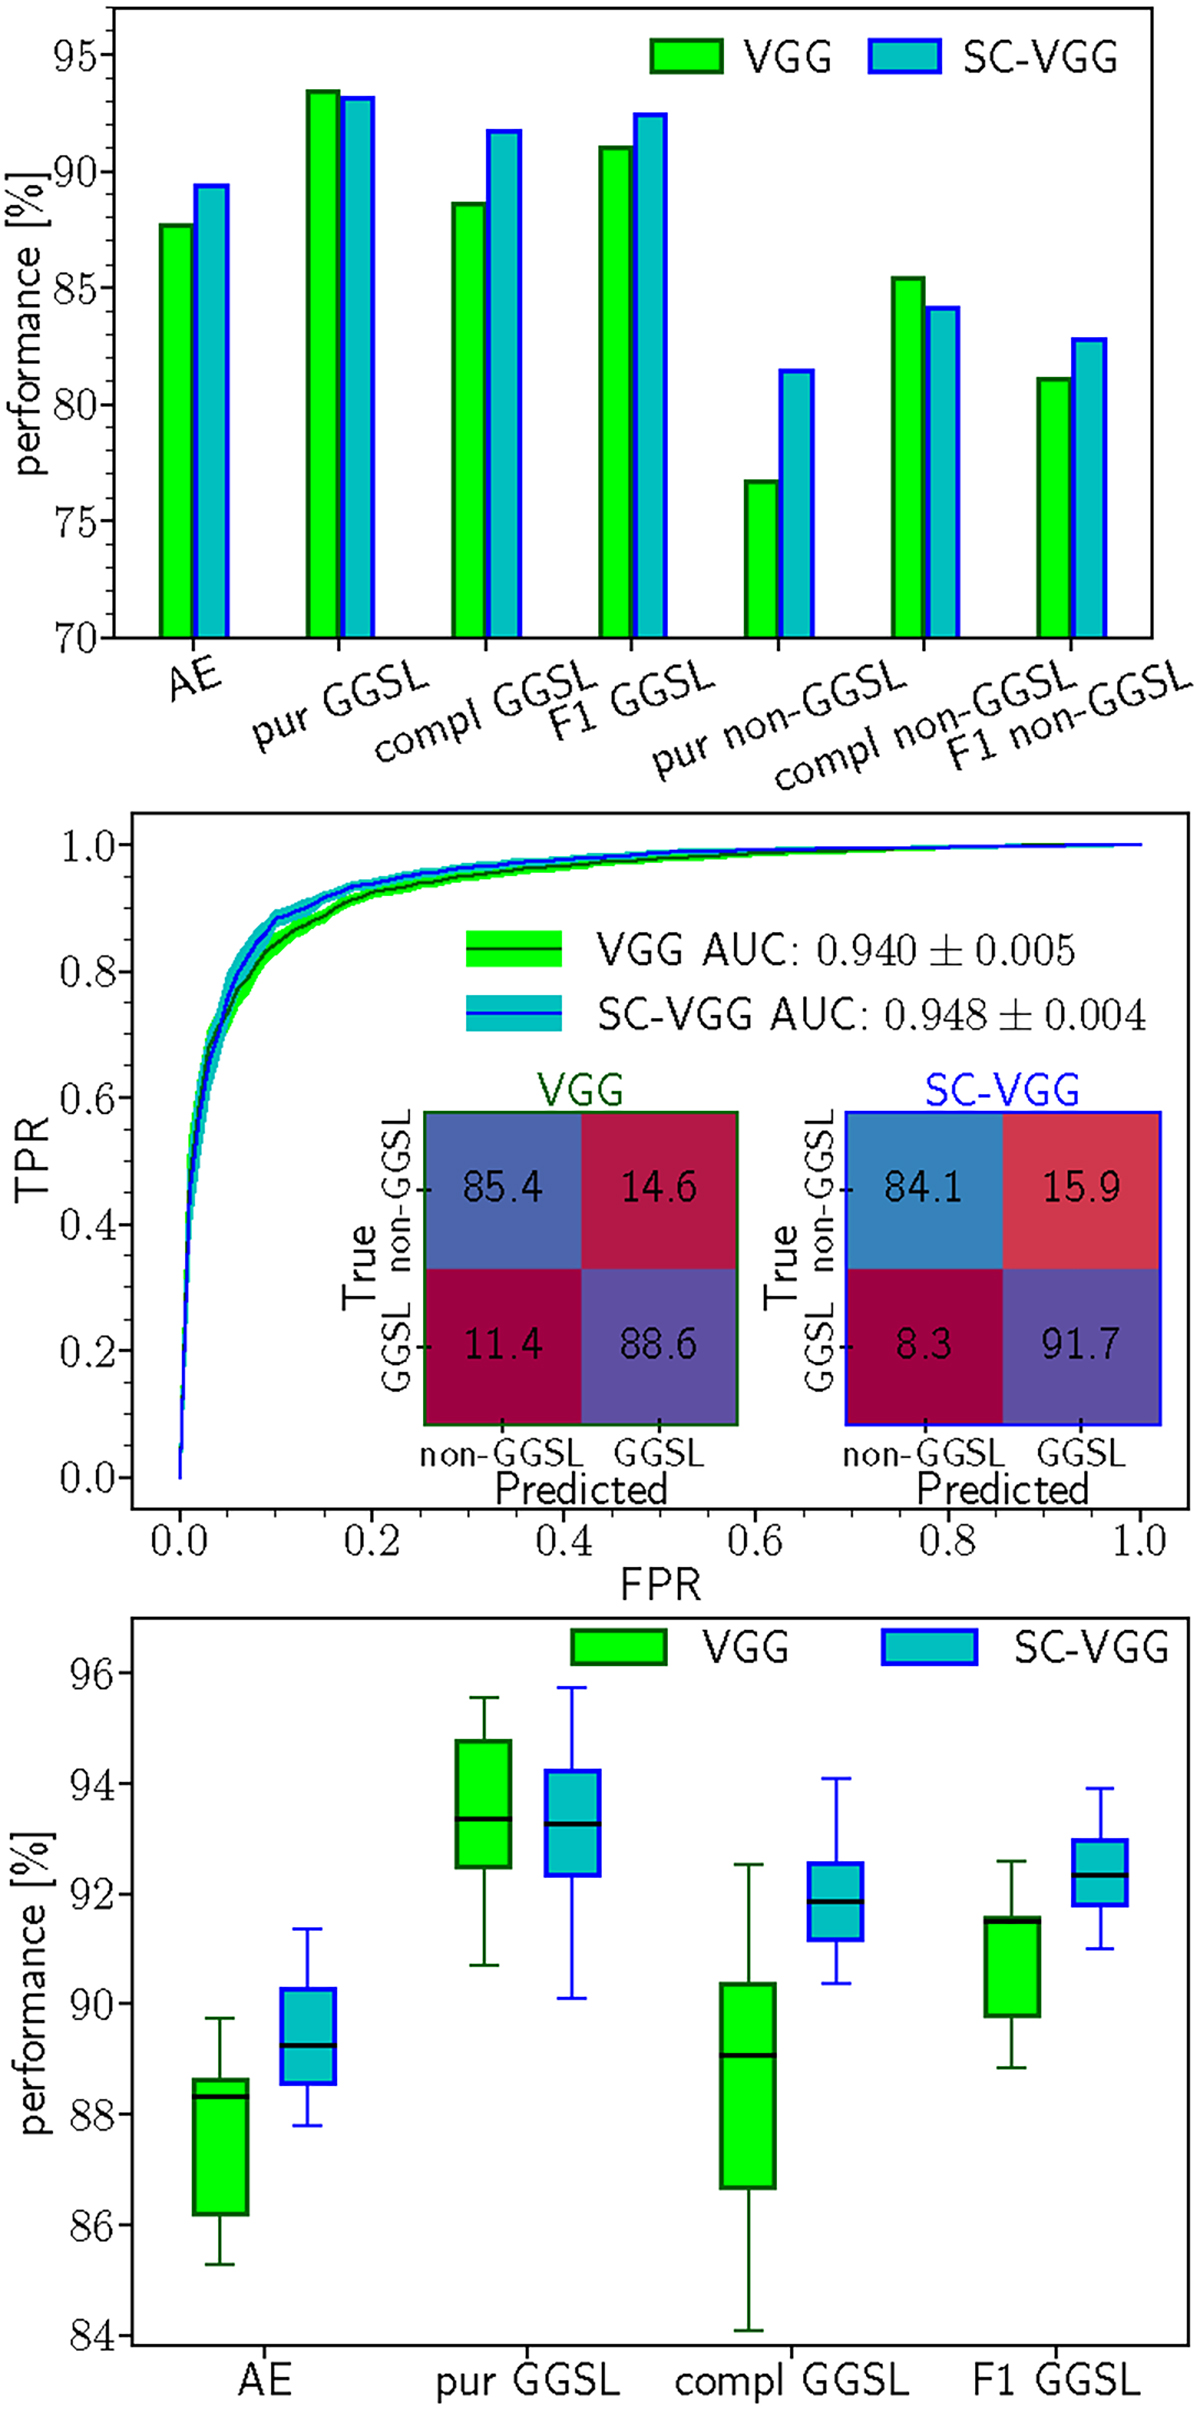
Fig. 6.
Download original image
Comparison between the performance of the two networks under study (in all panels, the VGG and SC-VGG results are shown in green and in cyan, respectively). Top panel: statistical performance estimators for the GGSL and non-GGSL classes. Middle panel: ROC curves for the GGSL classification, i.e. TPR vs FPR (the lines and the coloured areas represent the mean and the 1σ level, respectively); here, the AUC values are quoted in the legend and the normalised confusion matrices are also shown. Bottom panel: box plots for the GGSL metrics and AE for both classes (see Sect. 4.1 for details).
Current usage metrics show cumulative count of Article Views (full-text article views including HTML views, PDF and ePub downloads, according to the available data) and Abstracts Views on Vision4Press platform.
Data correspond to usage on the plateform after 2015. The current usage metrics is available 48-96 hours after online publication and is updated daily on week days.
Initial download of the metrics may take a while.