Fig. 4.
Download original image
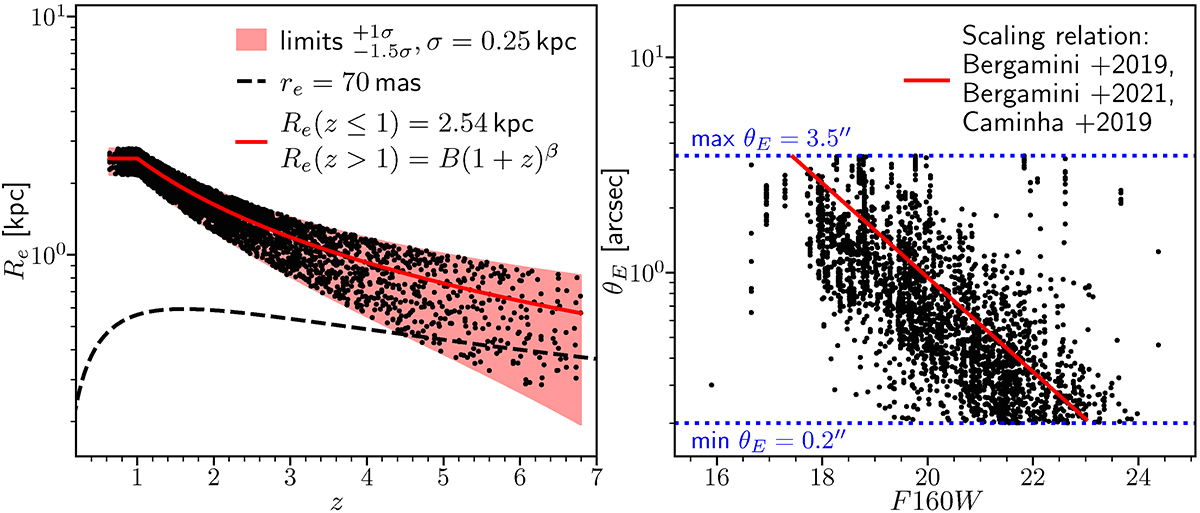
Simulation details. Left panel: adopted relation for the redshift evolution of Re, constant for z ≤ 1, and taken from Shibuya et al. (2015) for z > 1, together with the upper and lower limits within which Re is extracted (light red area). The black dashed line shows the 0.070″ threshold – under which the source size is indistinguishable from the PSF – after the convolution. Right panel: resulting scaling relation, i.e. θE vs. F160W, compared to those from Bergamini et al. (2019, 2021a) and Caminha et al. (2019), in red.
Current usage metrics show cumulative count of Article Views (full-text article views including HTML views, PDF and ePub downloads, according to the available data) and Abstracts Views on Vision4Press platform.
Data correspond to usage on the plateform after 2015. The current usage metrics is available 48-96 hours after online publication and is updated daily on week days.
Initial download of the metrics may take a while.