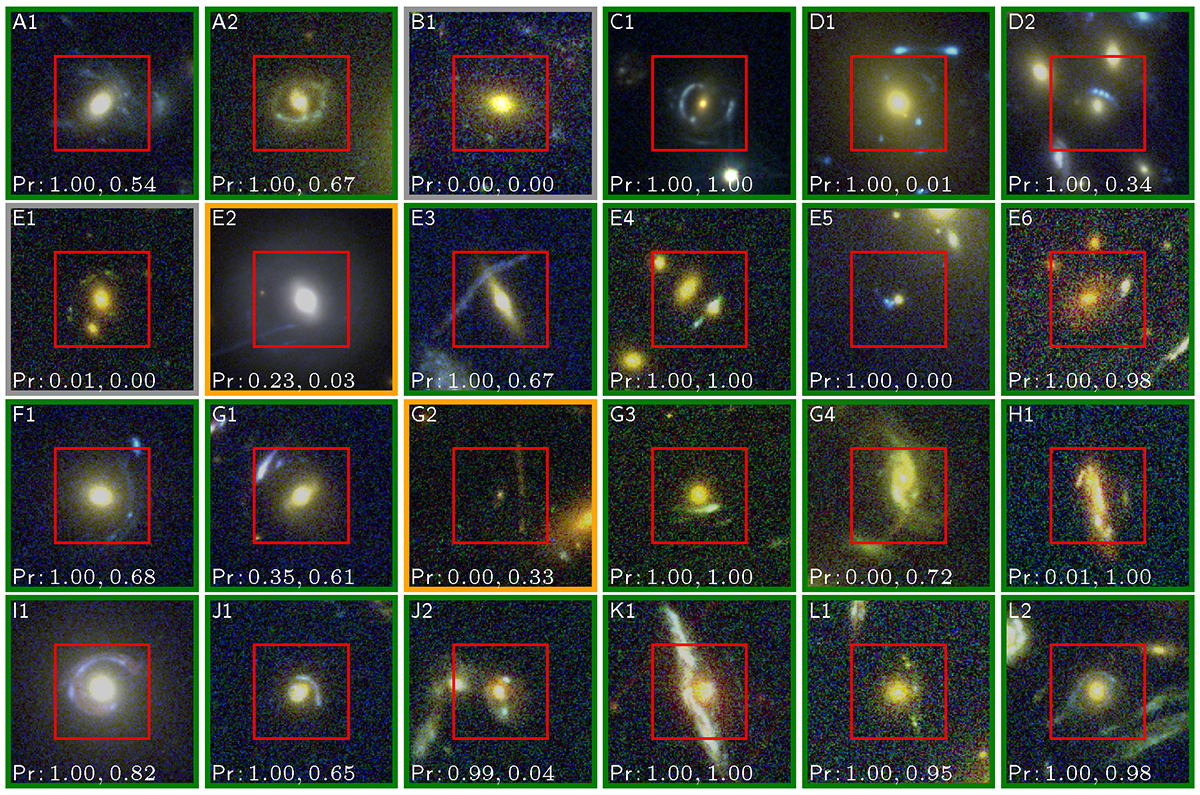
Fig. 12.
Download original image
Known GGSLs processed by both VGG and SC-VGG networks (see Table A.6). The GGSL probability is reported in each thumbnail (referred to the VGG and SC-VGG, respectively). Cutouts are 7.7″ across. The inner red squares enclose the area processed by the networks (∼4″). According to the classification probability, cutouts are surrounded by a box coloured in green (at least one probability is > 0.5), orange (at least one probability is ∈(0.2, 0.5]), or grey (otherwise).
Current usage metrics show cumulative count of Article Views (full-text article views including HTML views, PDF and ePub downloads, according to the available data) and Abstracts Views on Vision4Press platform.
Data correspond to usage on the plateform after 2015. The current usage metrics is available 48-96 hours after online publication and is updated daily on week days.
Initial download of the metrics may take a while.