Open Access
Fig. 10.
Download original image
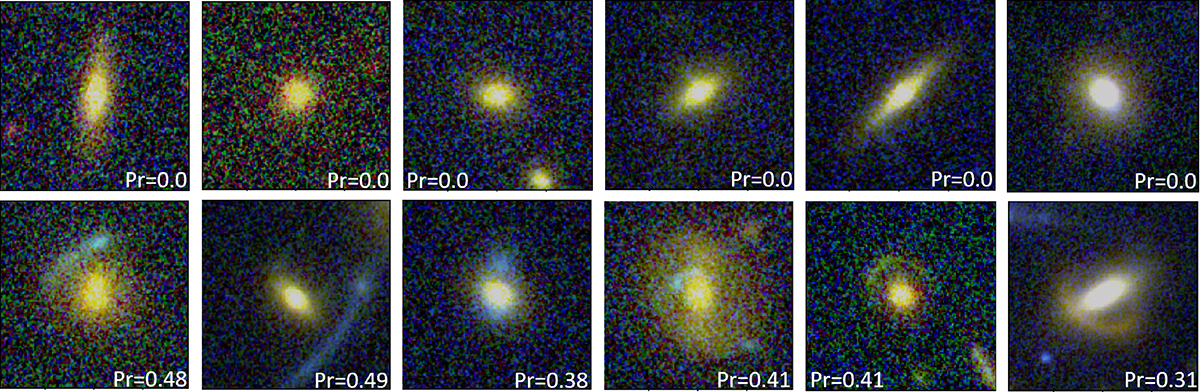
Selection of FNs common to both the VGG and SC-VGG models. The probability of being a GGSL is shown in each thumbnail (estimated by the SC-VGG model). Cutouts are ∼4″ across.
Current usage metrics show cumulative count of Article Views (full-text article views including HTML views, PDF and ePub downloads, according to the available data) and Abstracts Views on Vision4Press platform.
Data correspond to usage on the plateform after 2015. The current usage metrics is available 48-96 hours after online publication and is updated daily on week days.
Initial download of the metrics may take a while.