Fig. A.1.
Download original image
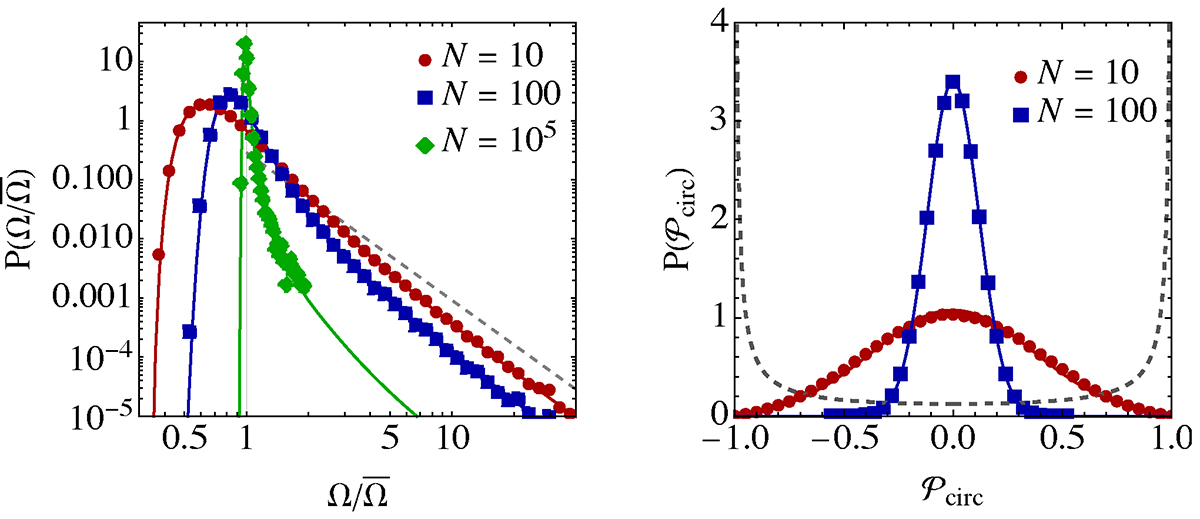
Distributions of the total signal strengths from 1, 10, 100, and 105 sources whose independent signal strengths have identical ![]() tails (left). Distribution of 𝒫circ for 1, 10 and 100 identical sources (right). The dashed line shows the distribution from a single source, the solid lines show the analytic estimates, and the distributions obtained from an explicit Monte Carlo analysis are shown by the points.
tails (left). Distribution of 𝒫circ for 1, 10 and 100 identical sources (right). The dashed line shows the distribution from a single source, the solid lines show the analytic estimates, and the distributions obtained from an explicit Monte Carlo analysis are shown by the points.
Current usage metrics show cumulative count of Article Views (full-text article views including HTML views, PDF and ePub downloads, according to the available data) and Abstracts Views on Vision4Press platform.
Data correspond to usage on the plateform after 2015. The current usage metrics is available 48-96 hours after online publication and is updated daily on week days.
Initial download of the metrics may take a while.