Fig. B.4.
Download original image
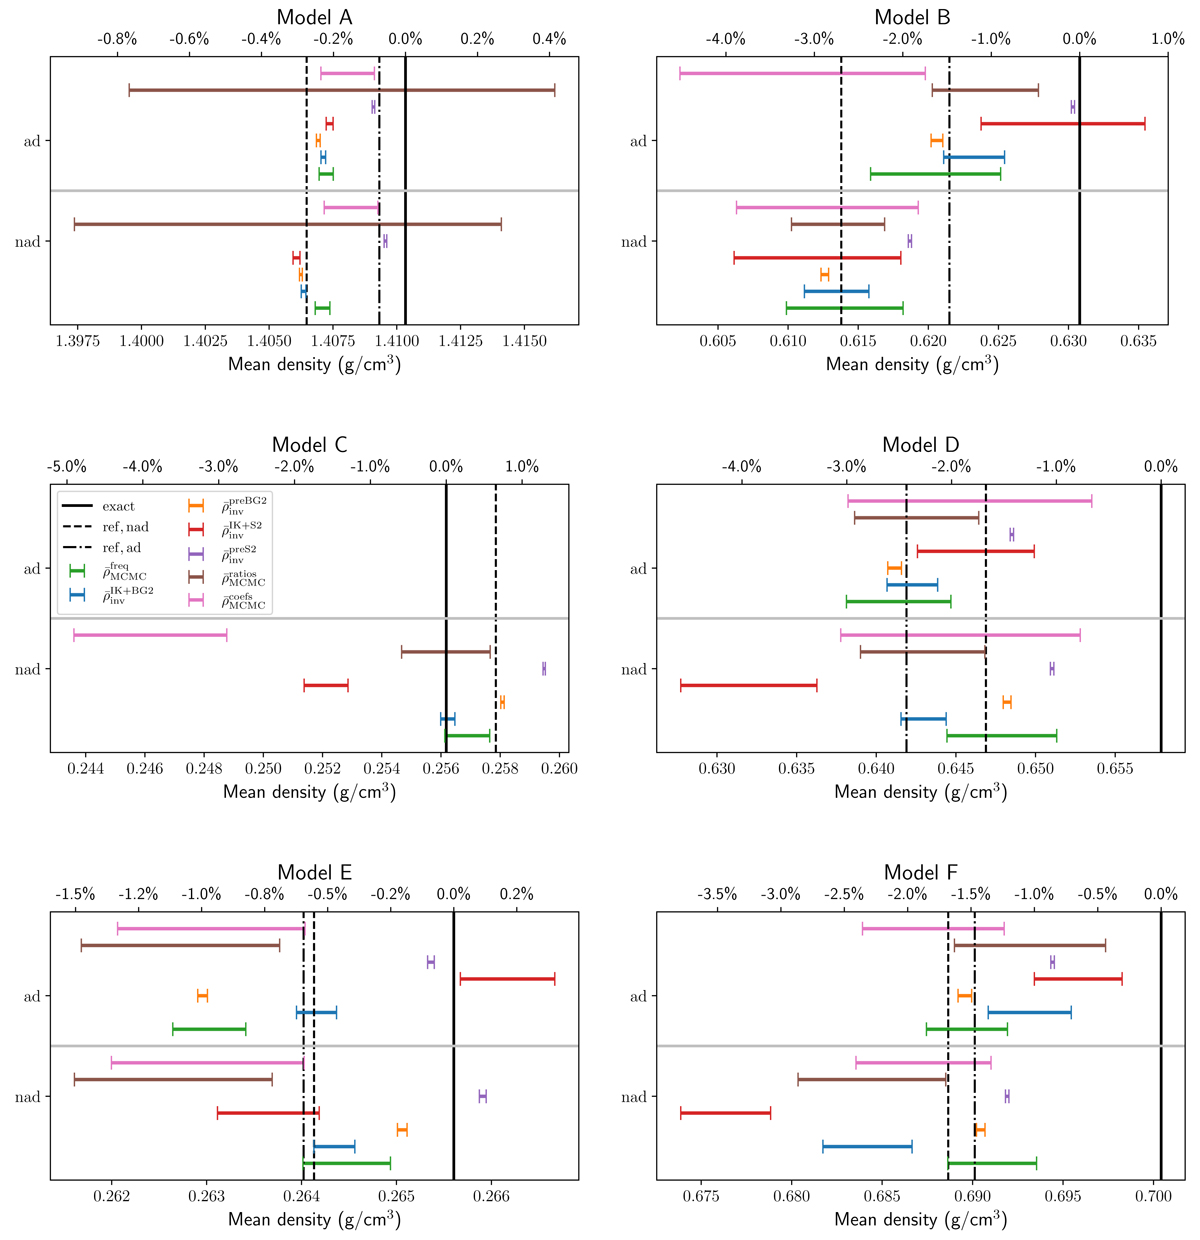
Mean density of the Sonoi et al. (2015) targets estimated using different techniques to account for the surface effects or damp them. The dashed and dot-dashed black lines correspond to the mean density of the reference model with and without the non-adiabatic correction, respectively. The exact mean density is shown by the solid black line. Each panel is divided into two parts, separated by a solid grey line. The lower part shows the results using the frequencies that include the non-adiabatic correction (labelled nad), and the upper part is based on the frequencies that do not include this correction (labelled ad). For model C, there are no ad results because the MCMC that provides the reference model did not converge successfully with this set of frequencies.
Current usage metrics show cumulative count of Article Views (full-text article views including HTML views, PDF and ePub downloads, according to the available data) and Abstracts Views on Vision4Press platform.
Data correspond to usage on the plateform after 2015. The current usage metrics is available 48-96 hours after online publication and is updated daily on week days.
Initial download of the metrics may take a while.