Open Access
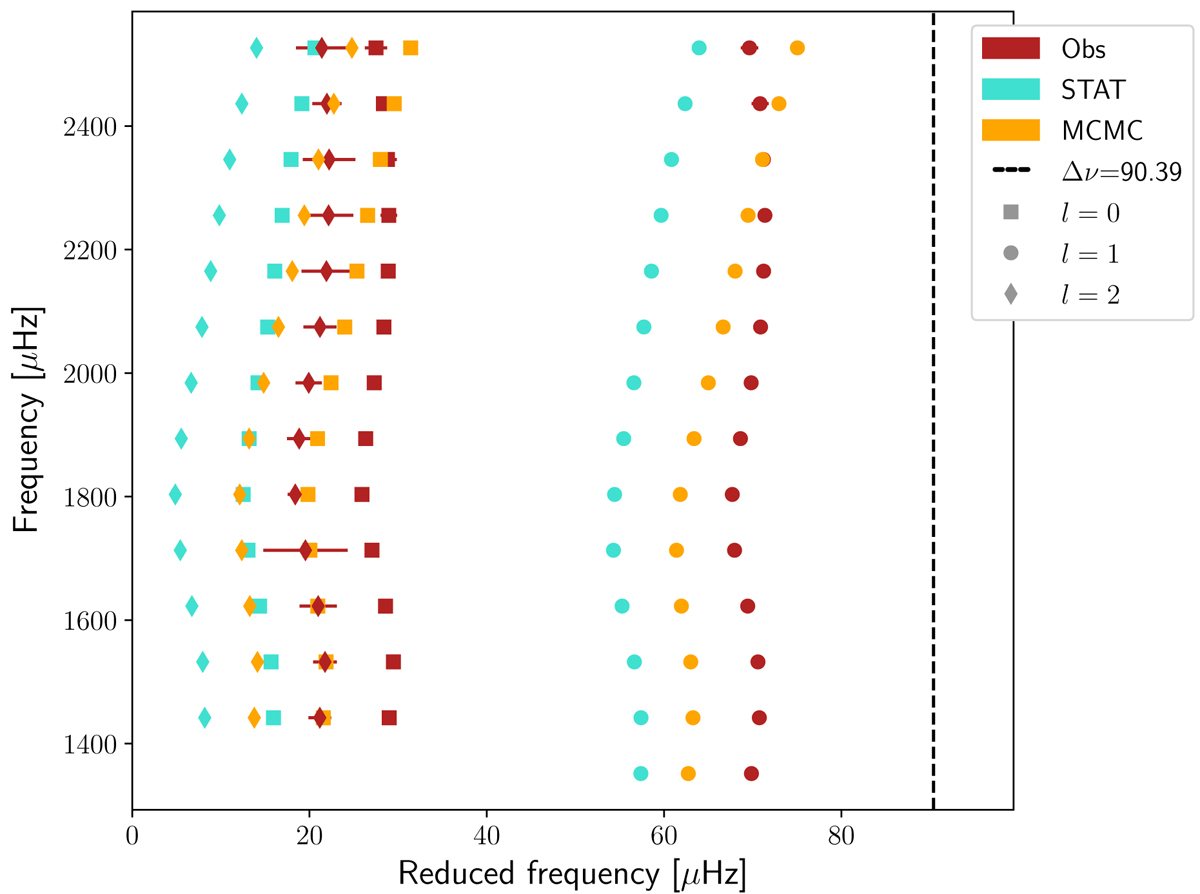
Fig. B.3.
Download original image
Illustration of an imperfect anchoring of the frequency ridges. The observed frequencies are shown in red. The cyan frequencies correspond to the model based on the median of the posterior distributions of the MCMC run, and the orange model shows the best MCMC model, which minimises the χ2.
Current usage metrics show cumulative count of Article Views (full-text article views including HTML views, PDF and ePub downloads, according to the available data) and Abstracts Views on Vision4Press platform.
Data correspond to usage on the plateform after 2015. The current usage metrics is available 48-96 hours after online publication and is updated daily on week days.
Initial download of the metrics may take a while.