Open Access
Fig. 1.
Download original image
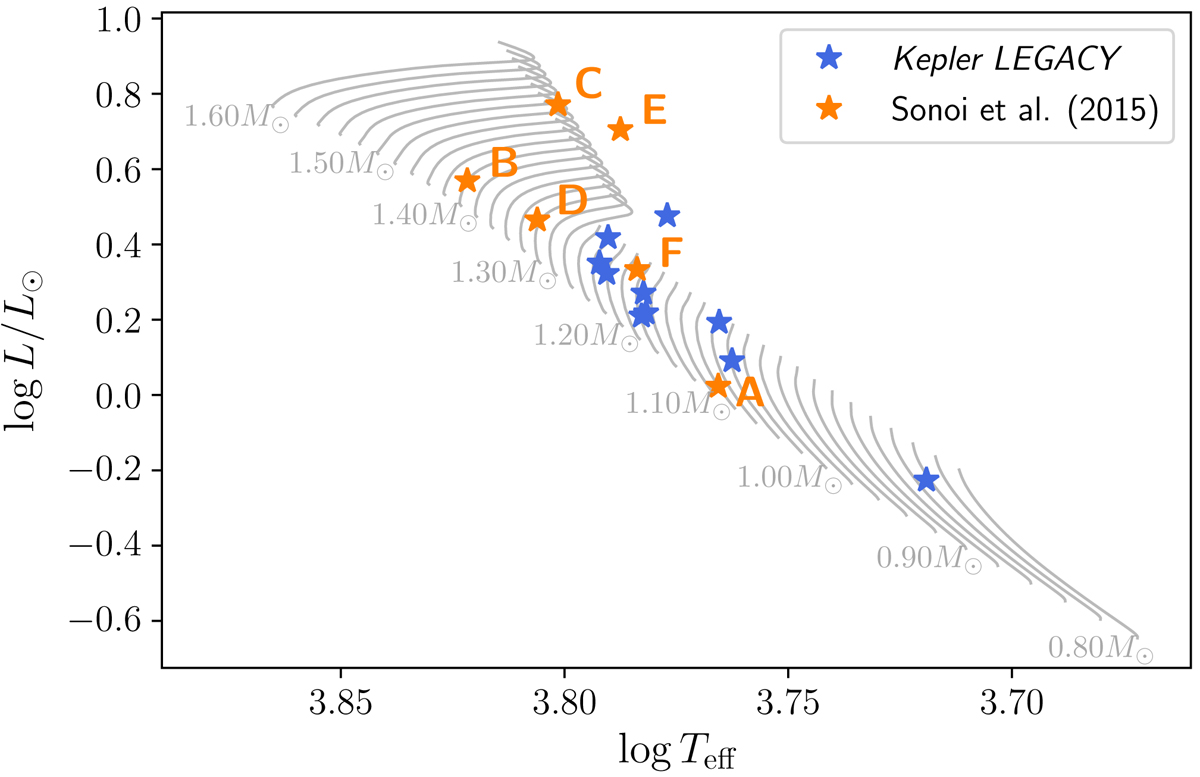
HR diagram of the targets considered in this work. The Sonoi et al. (2015) targets are denoted by the orange stars, and the Kepler LEGACY targets are indicated by the blue stars. The grey lines correspond to the evolutionary tracks from a slice of the Spelaion grid with X0 = 0.72, Z0 = 0.018, and αov = 0.00.
Current usage metrics show cumulative count of Article Views (full-text article views including HTML views, PDF and ePub downloads, according to the available data) and Abstracts Views on Vision4Press platform.
Data correspond to usage on the plateform after 2015. The current usage metrics is available 48-96 hours after online publication and is updated daily on week days.
Initial download of the metrics may take a while.