Fig. 2
Download original image
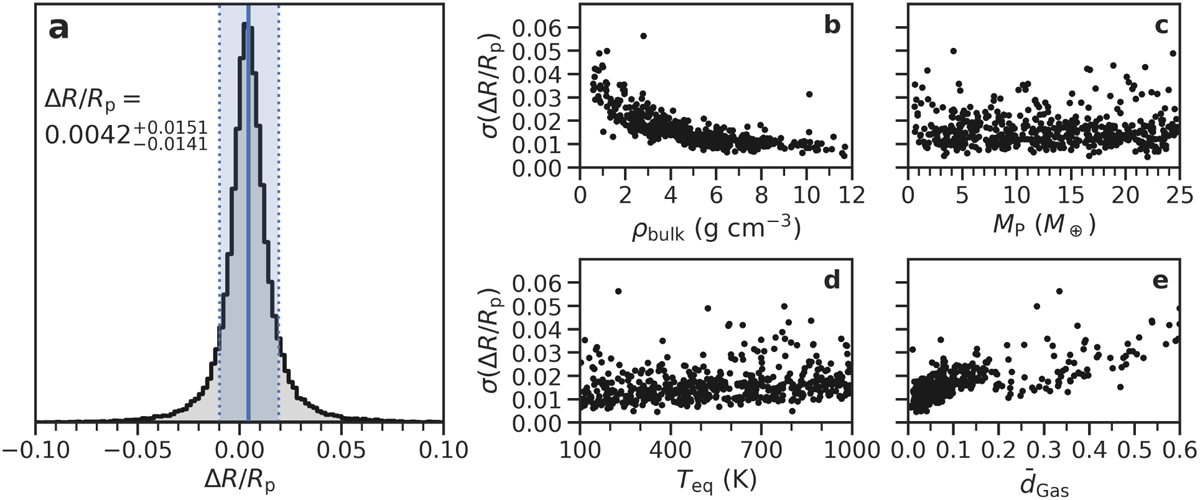
Radius accuracy of Model 1 after recalculating the planet interior based on the MDN prediction. Panel a shows the distribution of the relative radius error of 10000 sample points. The blue line marks the median, with the blue area showing the range where 80% of values lie. Panels b–e show the standard deviation in relative radius errors σ for a variety of planet parameters: bulk density (b), planet mass (c), equilibrium temperature (d), and average atmosphere thickness ![]() of recomputed planet samples (e). Each point represents one of 500 planets from the test data set (see the text for more details).
of recomputed planet samples (e). Each point represents one of 500 planets from the test data set (see the text for more details).
Current usage metrics show cumulative count of Article Views (full-text article views including HTML views, PDF and ePub downloads, according to the available data) and Abstracts Views on Vision4Press platform.
Data correspond to usage on the plateform after 2015. The current usage metrics is available 48-96 hours after online publication and is updated daily on week days.
Initial download of the metrics may take a while.