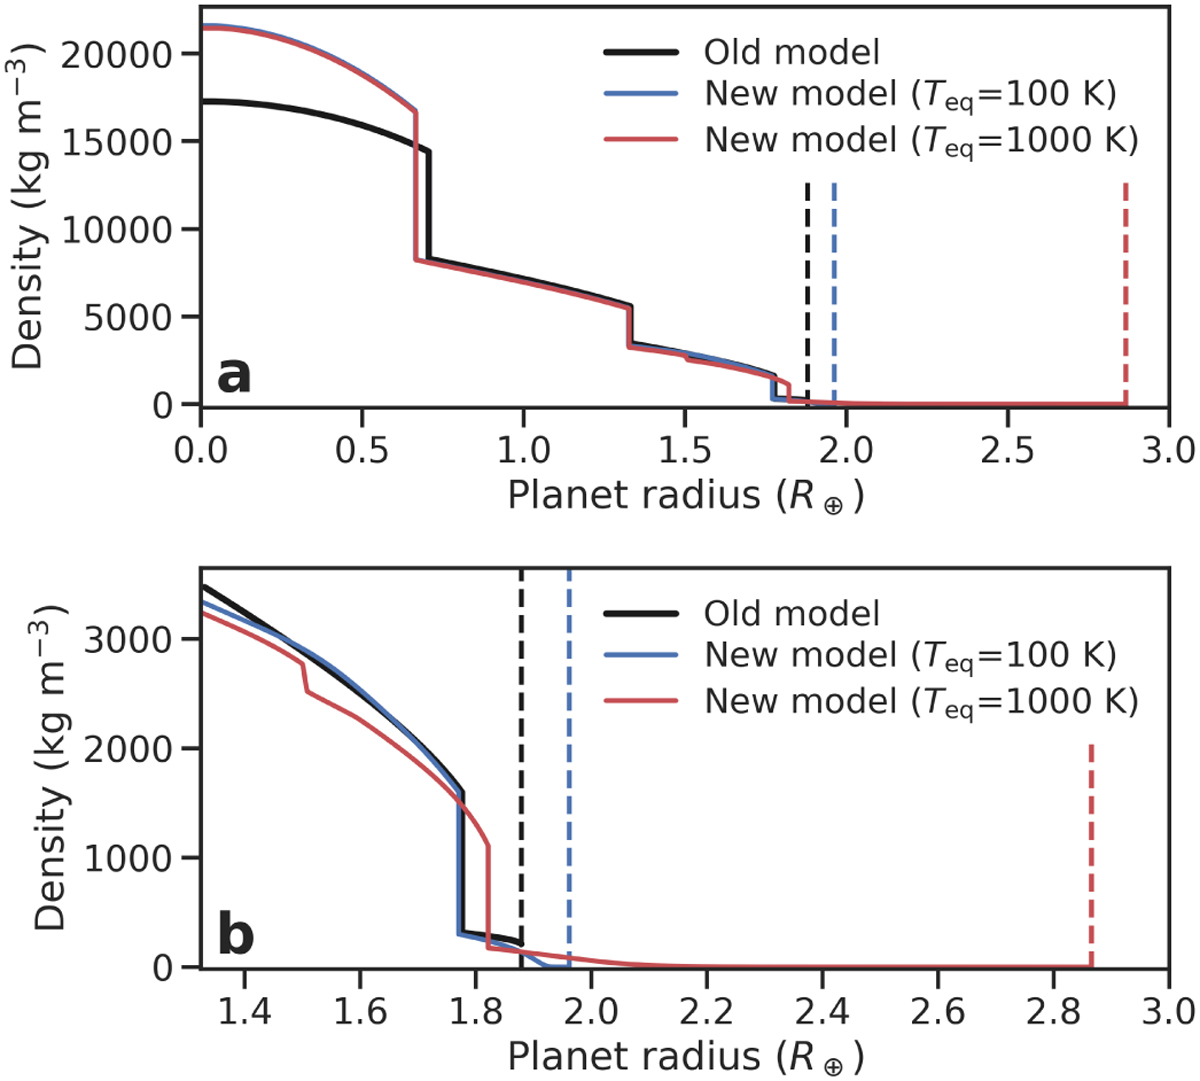
Fig. B.5
Download original image
Illustration of the differences in interior models between the previous work (Baumeister et al. 2020, black line) and this work (blue and red lines, for two different equilibrium temperatures Teq = 100K and Teq = 1000K, respectively). The figure shows density profiles of a representative 5 M⊕ planet with wCore = 0.2, wMantle = 0.49, wWater = 0.3, and wGas = 0.01 (Panel a). Panel b shows a zoomed-in view of only the water and atmosphere layers. The dashed lines mark the respective planets’ radii.
Current usage metrics show cumulative count of Article Views (full-text article views including HTML views, PDF and ePub downloads, according to the available data) and Abstracts Views on Vision4Press platform.
Data correspond to usage on the plateform after 2015. The current usage metrics is available 48-96 hours after online publication and is updated daily on week days.
Initial download of the metrics may take a while.