Fig. 9.
Download original image
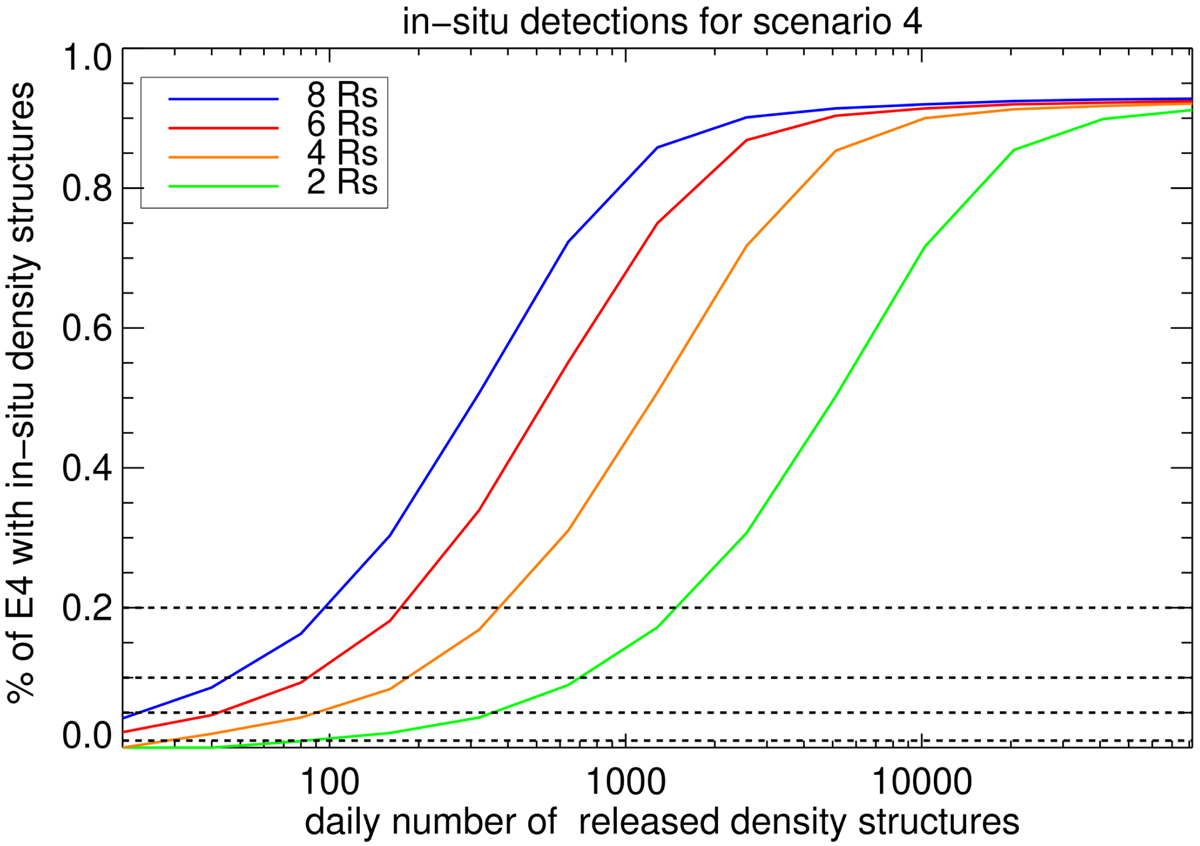
50% quartiles of the percentage of the E4 duration consistent with in situ detection of density structures with radial sizes, 2 R⊙ (green line), 4 R⊙ (orange line), 6 R⊙ (red line), and 8 R⊙ (blue line) as a function of the daily number of released density structures from the equatorial plane for the 1000 Monte Carlo simulations for Scenario 4. The horizontal dashed lines (from bottom to top) correspond to 1, 5, 10, and 20% of the E4 duration.
Current usage metrics show cumulative count of Article Views (full-text article views including HTML views, PDF and ePub downloads, according to the available data) and Abstracts Views on Vision4Press platform.
Data correspond to usage on the plateform after 2015. The current usage metrics is available 48-96 hours after online publication and is updated daily on week days.
Initial download of the metrics may take a while.