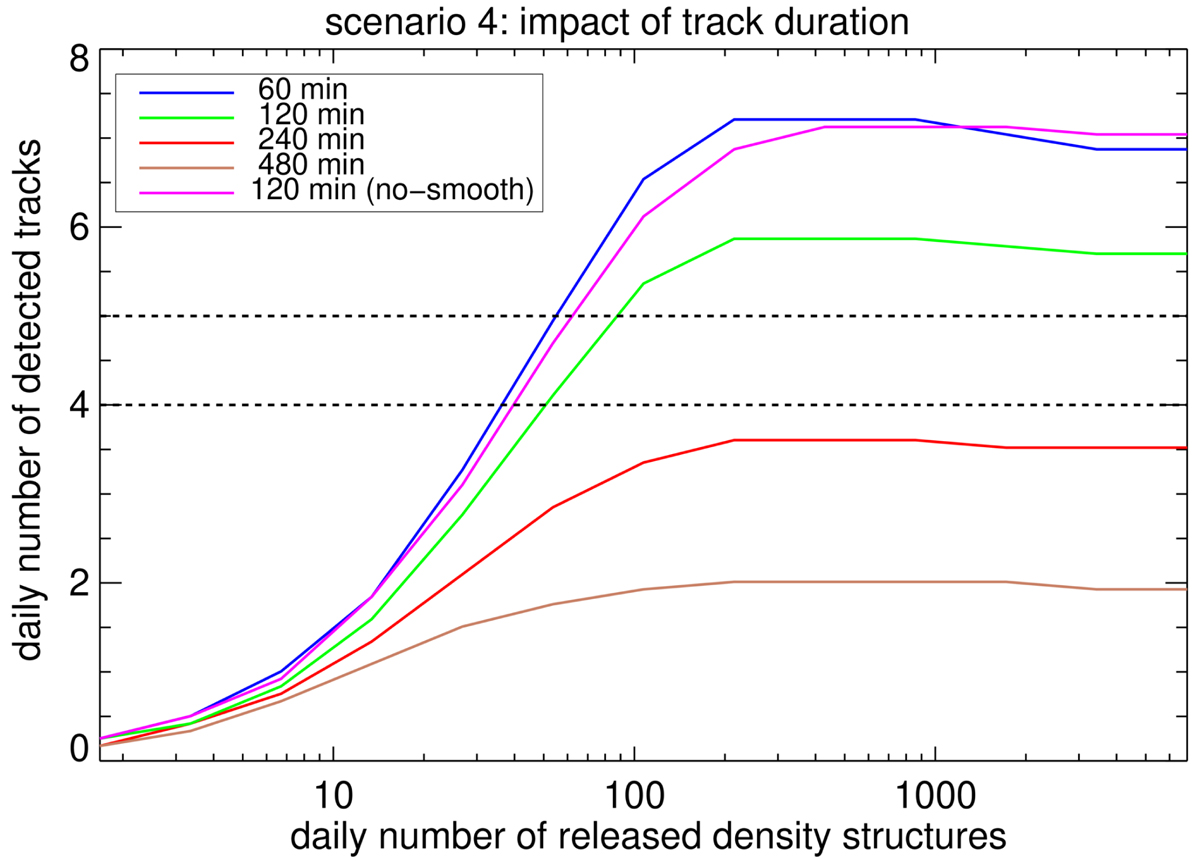
Fig. 8.
Download original image
50% quartiles of the daily number of detected tracks for the 1000 Monte Carlo simulations for Scenario 4 for J-map track duration (i.e., the interval between detected tracks; see Sect. 3) of 60, 120, 240, and 480 min (blue, green, red, brown lines, respectively). The purple line corresponds to results to when no smoothing is applied to the J-maps and the same temporal width as in our original study is used. The two horizontal dashed lines correspond to four and five daily J-map tracks, consistent with the observed J-map in Paper I.
Current usage metrics show cumulative count of Article Views (full-text article views including HTML views, PDF and ePub downloads, according to the available data) and Abstracts Views on Vision4Press platform.
Data correspond to usage on the plateform after 2015. The current usage metrics is available 48-96 hours after online publication and is updated daily on week days.
Initial download of the metrics may take a while.