Fig. 8
Download original image
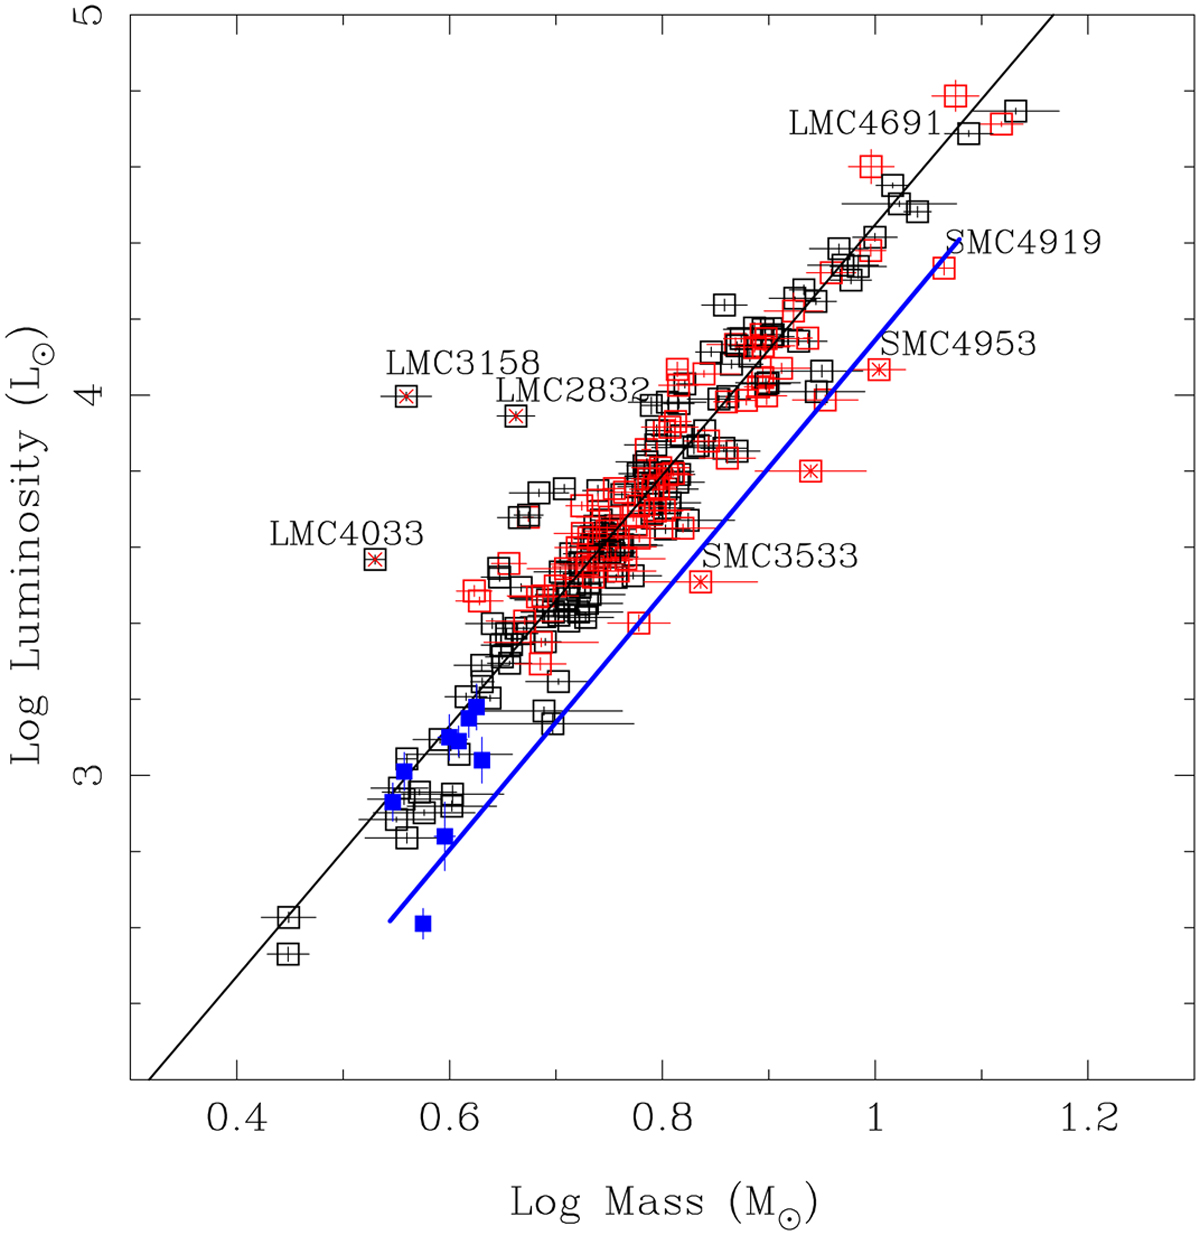
Mass-luminosity relation. Objects in the LMC are plotted as black, those in the SMC as red open squares. Stars outside the bulk of objects are identified. Objects in blue are the known CCs and their companions in EBs. The blue line indicates the canonical ML relation from Bono et al. (2000a) for Y = 0.255 and Z = 0.008. For Z = 0.004 the line would be at higher luminosities by about 0.1 dex. The black line indicates a fit to the LMC stars minus the outliers (see Eq. (12)) and lies almost exactly +0.3 dex above the canonical ML relation.
Current usage metrics show cumulative count of Article Views (full-text article views including HTML views, PDF and ePub downloads, according to the available data) and Abstracts Views on Vision4Press platform.
Data correspond to usage on the plateform after 2015. The current usage metrics is available 48-96 hours after online publication and is updated daily on week days.
Initial download of the metrics may take a while.