Fig. 7
Download original image
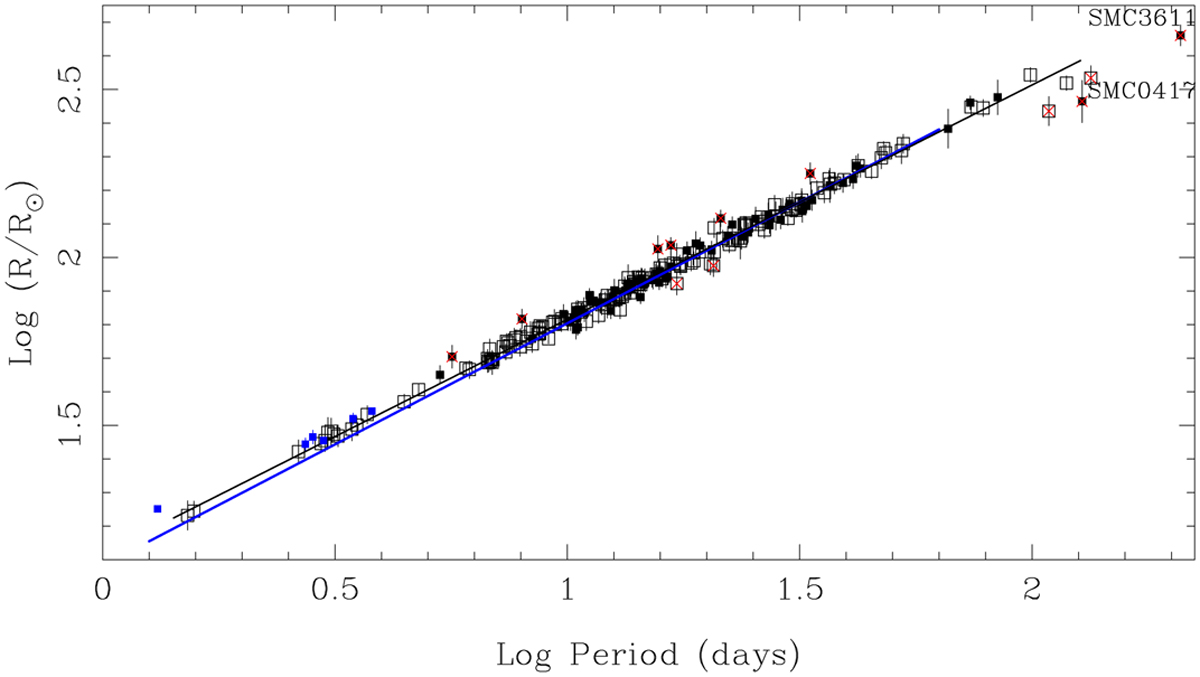
Period-radius relation. LMC objects are plotted as open squares, SMC objects are filled squares. Blue symbols indicate the six CCs in EBs. Outliers removed from the fit are marked by a red cross and some are identified. The black line indicates the best fit (excluding the outliers) to the complete MC sample. Fits to the LMC and SMC stars separately are given in the text. The blue line gives the PR relation for MW CCs from G20.
Current usage metrics show cumulative count of Article Views (full-text article views including HTML views, PDF and ePub downloads, according to the available data) and Abstracts Views on Vision4Press platform.
Data correspond to usage on the plateform after 2015. The current usage metrics is available 48-96 hours after online publication and is updated daily on week days.
Initial download of the metrics may take a while.