Fig. 3
Download original image
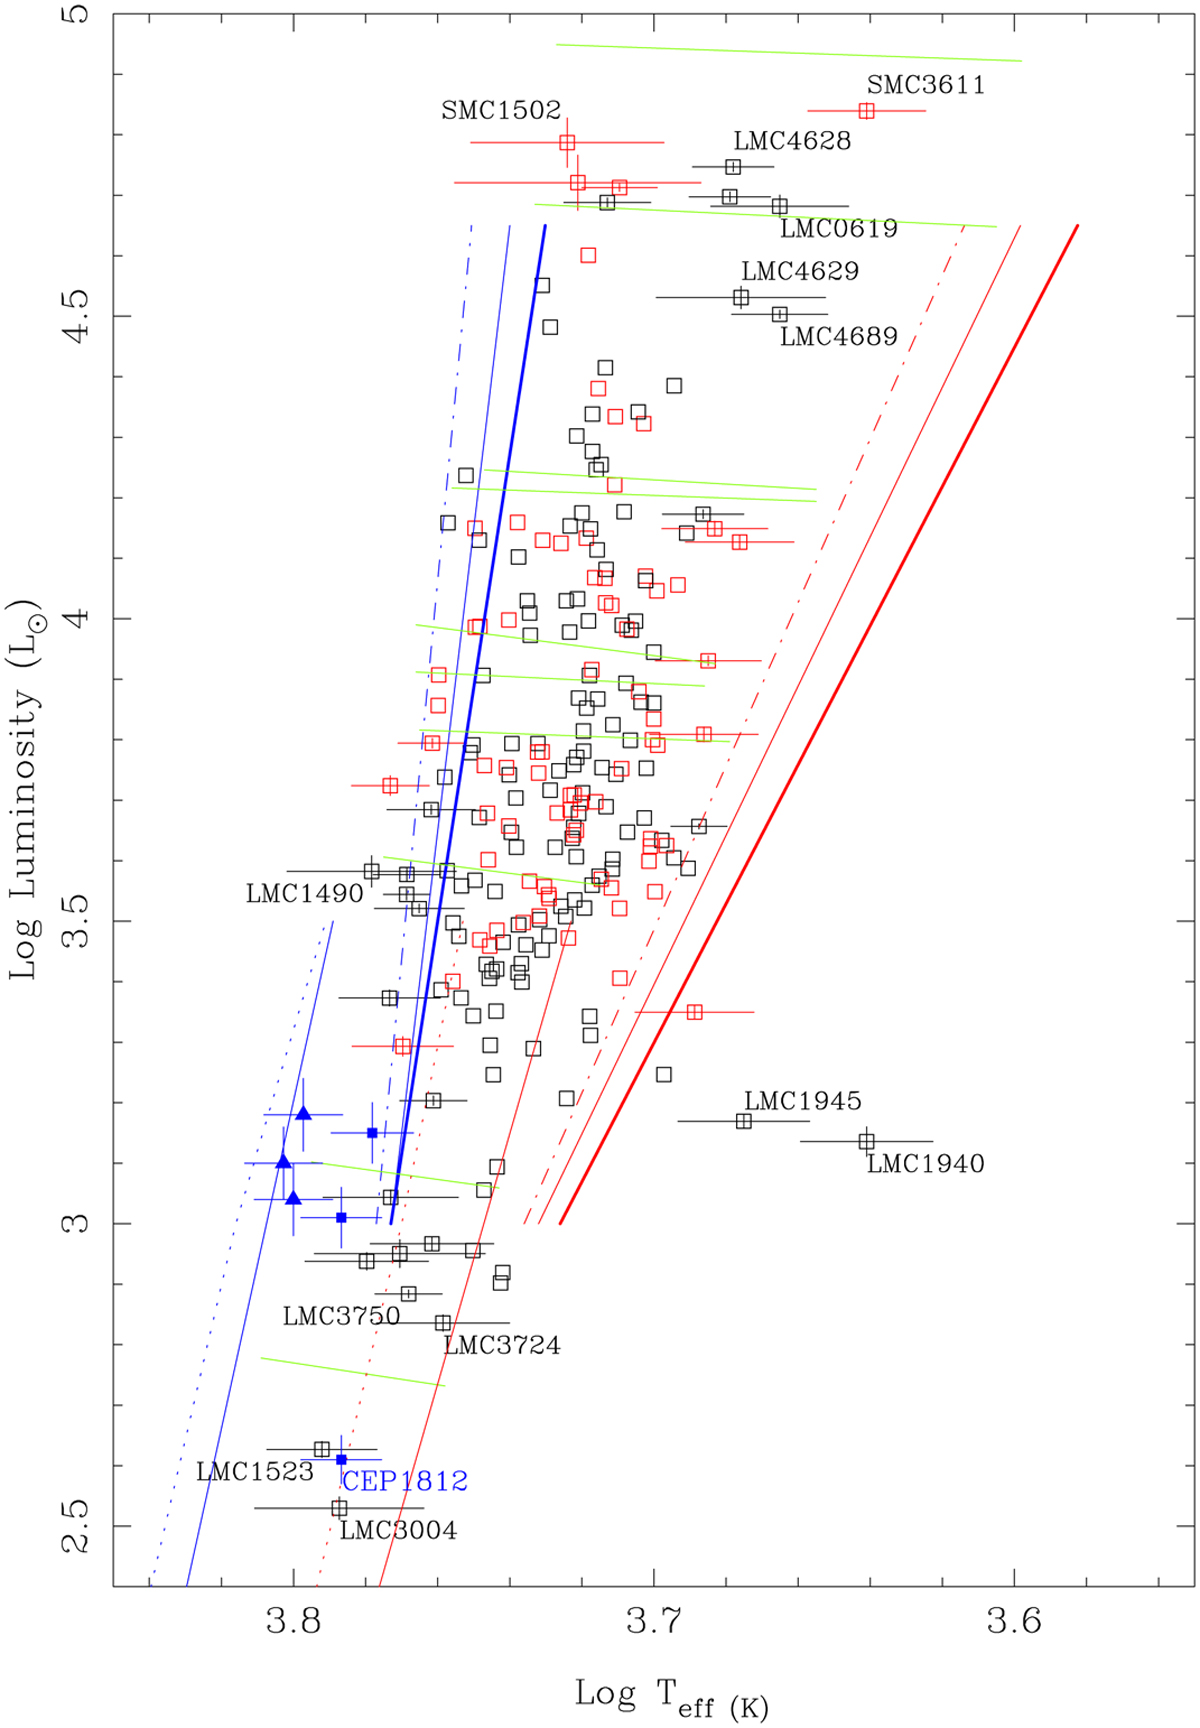
Hertzsprung-Russell diagram. Black and red open squares indicate LMC and SMC CCs from the sample, respectively. Stars located outside the bulk of objects are plotted with error bars, and some are labelled as well. Blue symbols with error bars indicate the six CCs in EBs (three FM as filled squares, three FO as filled triangles, see Table 2). Blue and red lines indicate the blue and red edge of the IS. In the upper part (brighter than log L = 3), the results from De Somma et al. (2021) are plotted. The thinner solid and dot-dashed line are for Z = 0.008 and Z = 0.004 models, respectively, for their type A mass-luminosity relation. The tick line is for Z = 0.008 for their type-B mass-luminosity relation. In the lower part (fainter than log L = 3.5), the results from Pilecki et al. (2018) are plotted for FM (solid lines) and FO (dotted lines) model. Green lines indicate evolutionary models from Anderson et al. (2016). See the main text for details.
Current usage metrics show cumulative count of Article Views (full-text article views including HTML views, PDF and ePub downloads, according to the available data) and Abstracts Views on Vision4Press platform.
Data correspond to usage on the plateform after 2015. The current usage metrics is available 48-96 hours after online publication and is updated daily on week days.
Initial download of the metrics may take a while.