Open Access
Fig. 10
Download original image
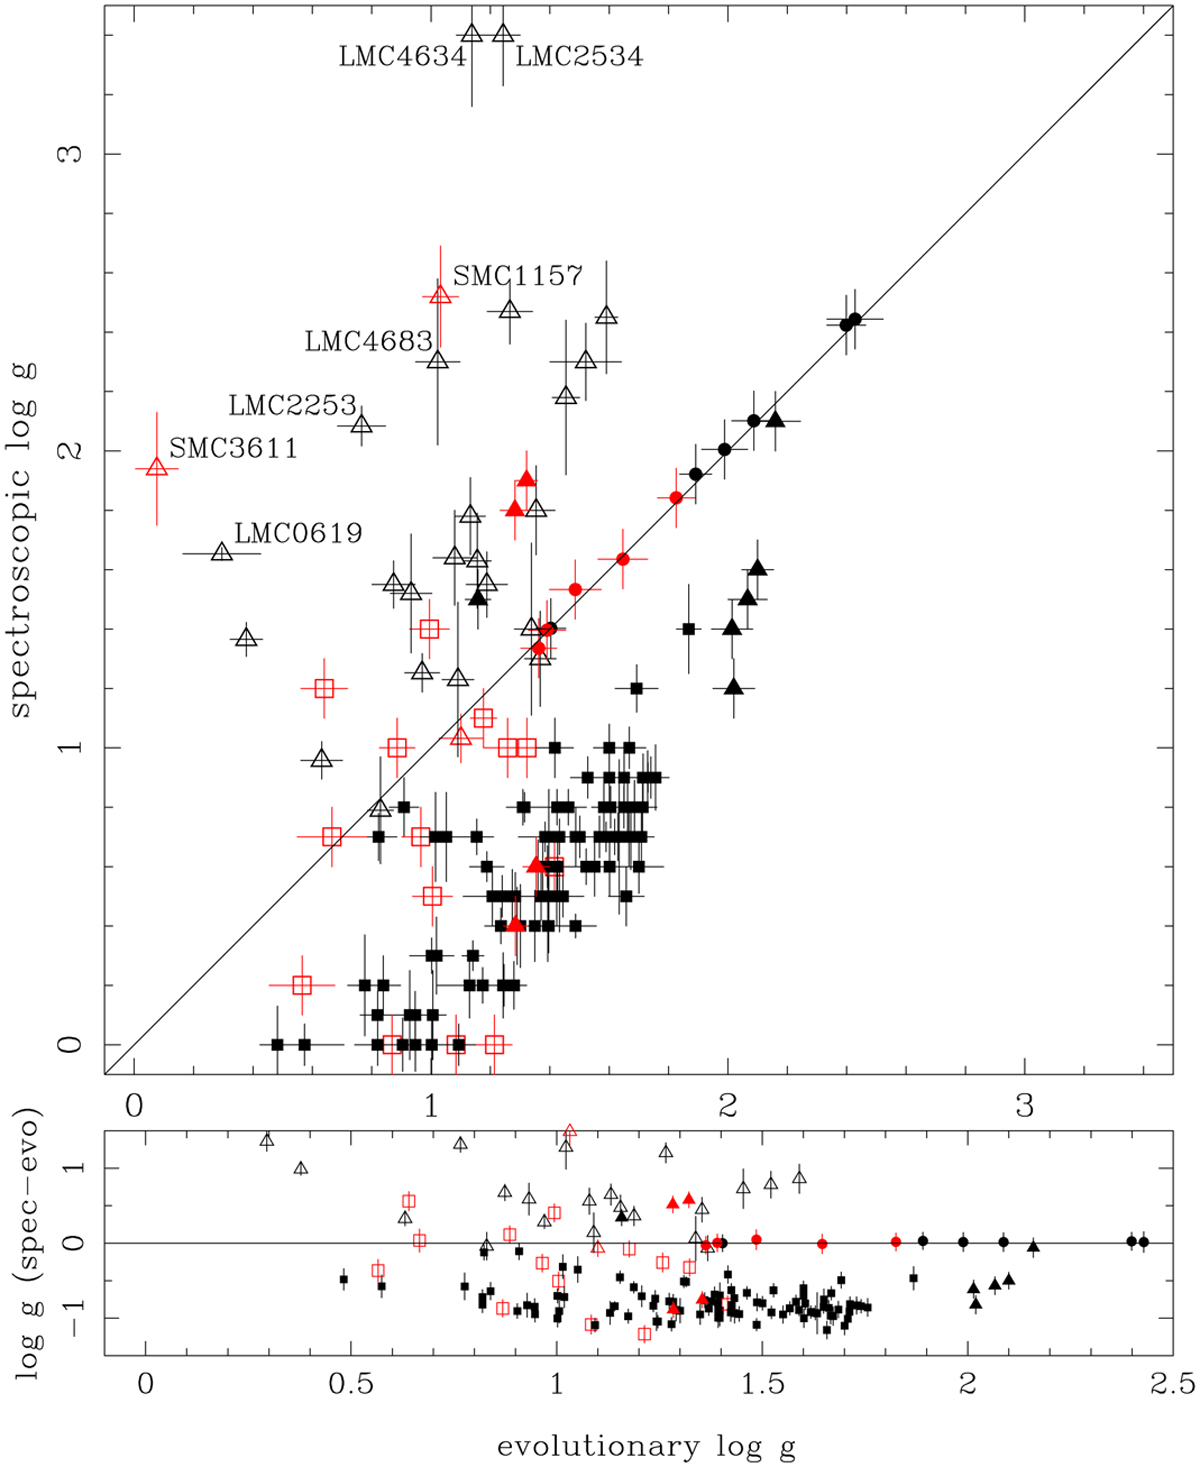
Comparison between the log ɡ determined in the literature, and the evolutionary value as determined from L and Teff from the SED fitting and the stellar mass based on various methods (see Appendix B). The one-to-one line is indicated. Stars outside the bulk of objects are identified. Symbols as in Fig. 9.
Current usage metrics show cumulative count of Article Views (full-text article views including HTML views, PDF and ePub downloads, according to the available data) and Abstracts Views on Vision4Press platform.
Data correspond to usage on the plateform after 2015. The current usage metrics is available 48-96 hours after online publication and is updated daily on week days.
Initial download of the metrics may take a while.