Fig. 9.
Download original image
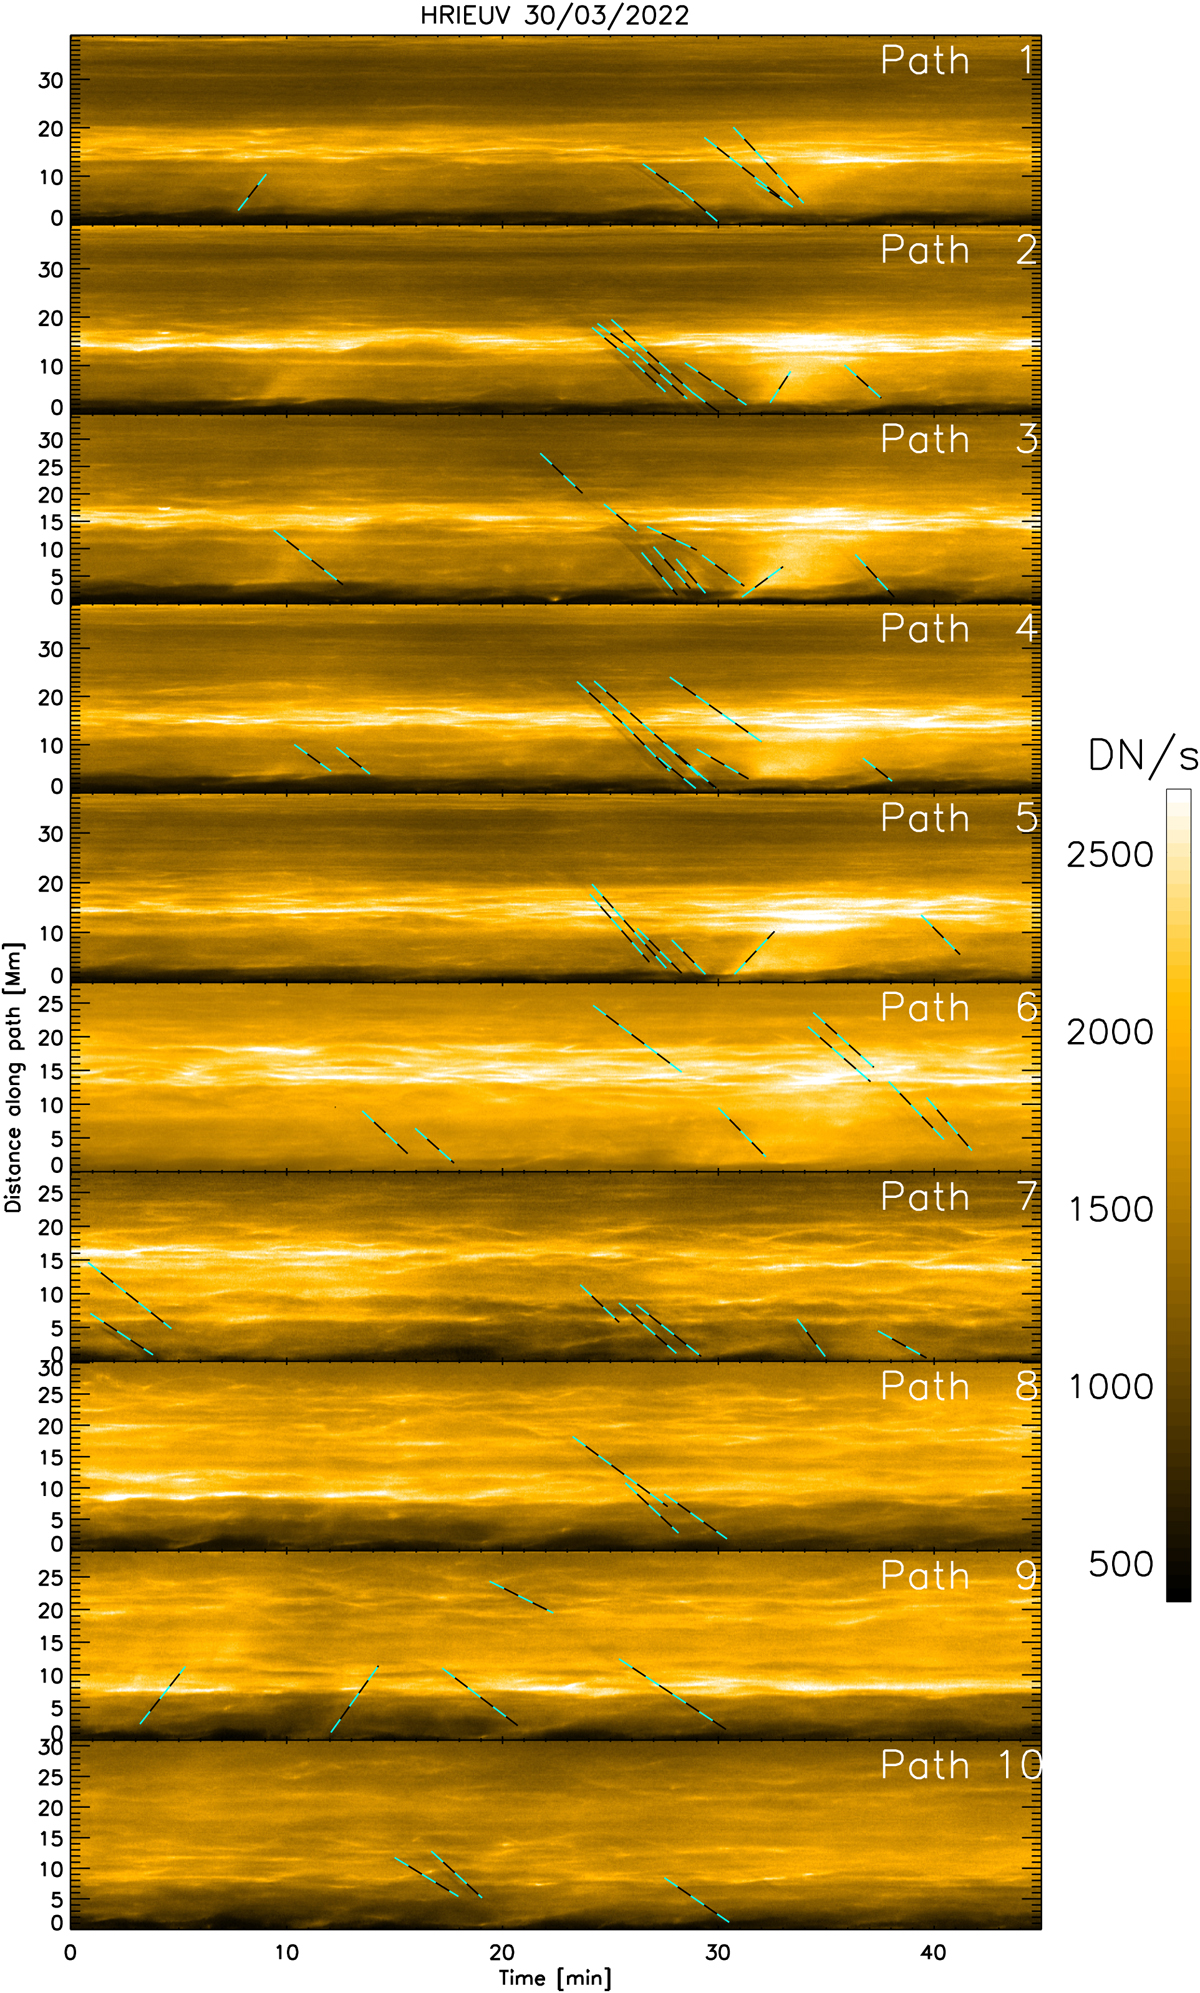
Time-distance diagrams for all coronal rain paths shown in the left panel of Fig. 1. The dashed cyan-black lines with negative slopes show some of the tracks produced by the rain clumps as they fall. The lines are offset in time by 1 min to show the rain features better. We note the extent of the rain shower across all paths. Upward-propagating features (positive slopes) can also be seen, particularly at the end of the rain shower (t ≈ 30 min). Zero distance corresponds to the footpoint of the loop (seen in Fig. 5).
Current usage metrics show cumulative count of Article Views (full-text article views including HTML views, PDF and ePub downloads, according to the available data) and Abstracts Views on Vision4Press platform.
Data correspond to usage on the plateform after 2015. The current usage metrics is available 48-96 hours after online publication and is updated daily on week days.
Initial download of the metrics may take a while.