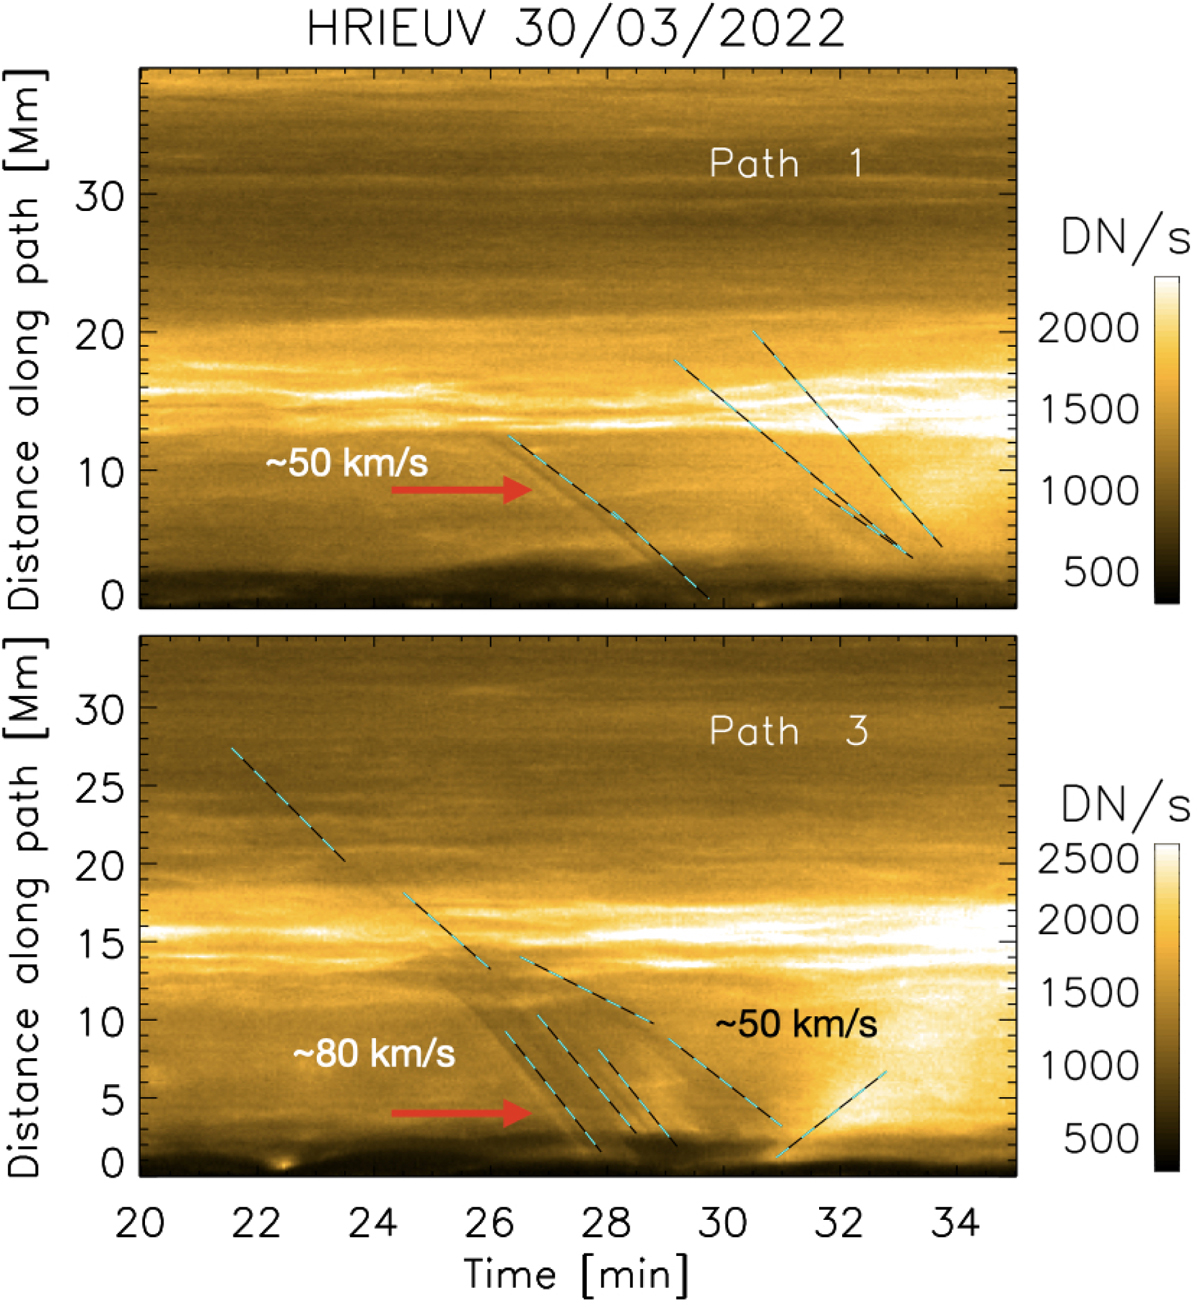
Fig. 8.
Download original image
Time-distance diagrams along paths 1 and 3 indicated in Fig. 5. The distance increases with height along the paths. The dark tracks traced by the dashed cyan-black lines correspond to EUV absorption from falling rain clumps. The dashed lines are offset by a fraction of a minute so that the rain features appear more clearly. An estimate of the projected velocity is given for the closest slope to each value. We note the bright tracks that are indicated by the red arrows immediately beneath the first dark tracks in each diagram. We interpret this feature as compression and heating from the clump. We interpret the upward bright and diffuse slope at the end of the time sequence (t ≈ 30 − 32 min) in path 3 as a combination of a rebound shock and flow produced by the rain impact on the chromosphere.
Current usage metrics show cumulative count of Article Views (full-text article views including HTML views, PDF and ePub downloads, according to the available data) and Abstracts Views on Vision4Press platform.
Data correspond to usage on the plateform after 2015. The current usage metrics is available 48-96 hours after online publication and is updated daily on week days.
Initial download of the metrics may take a while.