Fig. 7.
Download original image
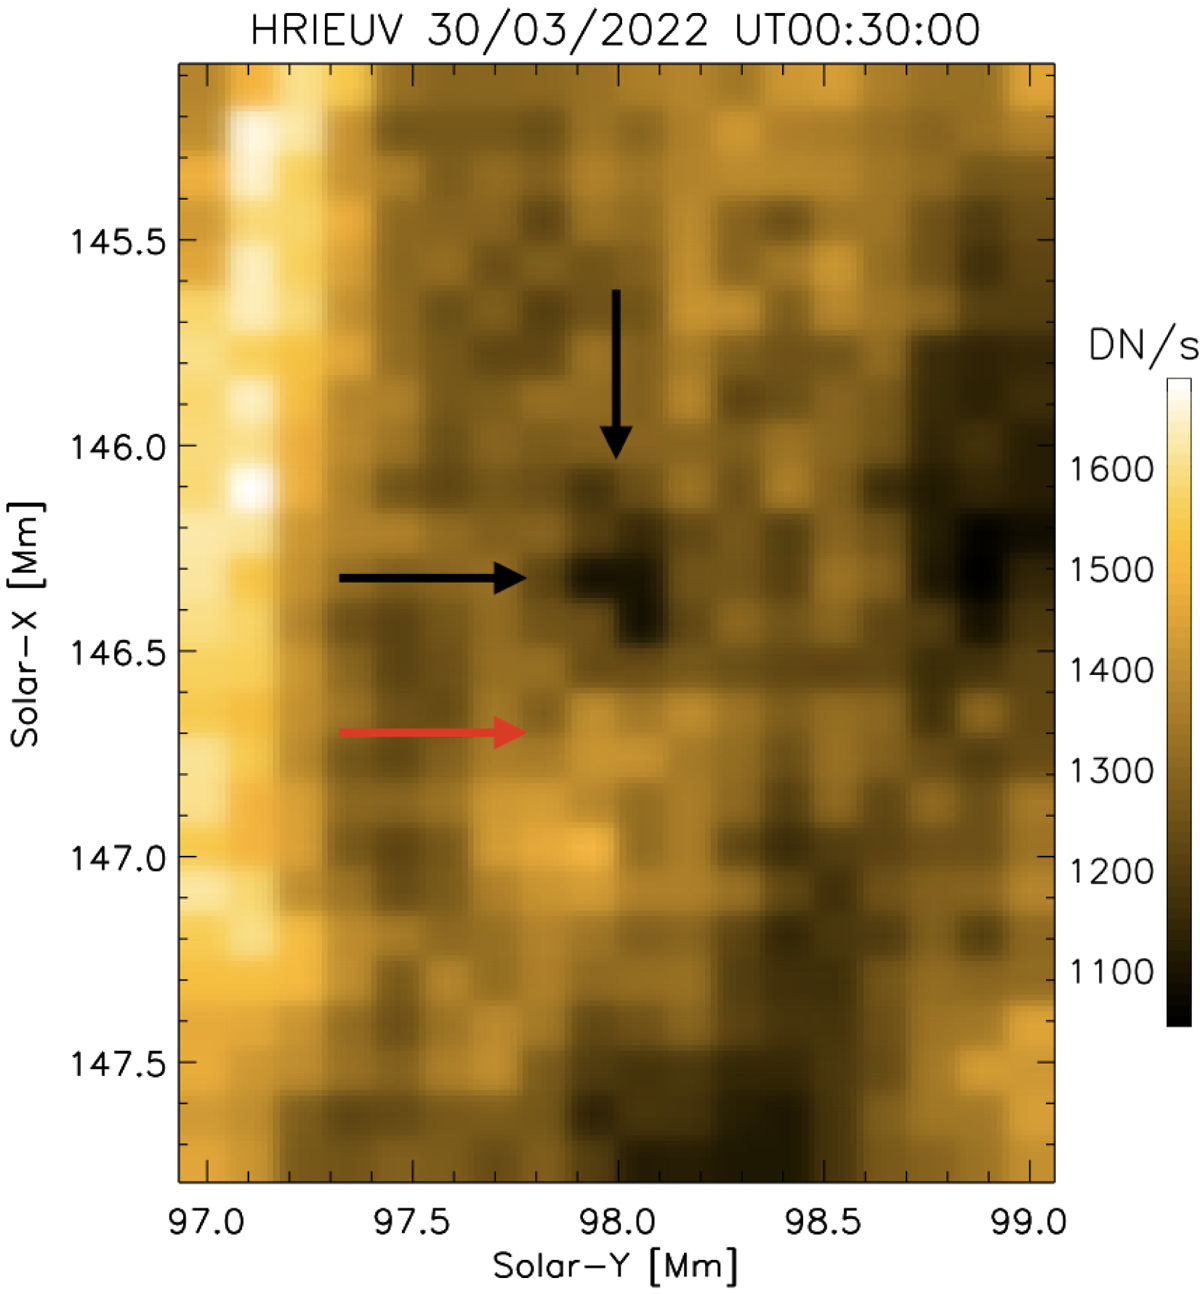
Close-up of the sub-FOV indicated by the white rectangle in Fig. 5. The dark feature indicated by the arrows corresponds to the EUV absorption produced by a rain clump. We interpret the bright feature below (downstream of) the rain clump indicated by the red arrow as compression and heating produced by the rain clump as it falls.
Current usage metrics show cumulative count of Article Views (full-text article views including HTML views, PDF and ePub downloads, according to the available data) and Abstracts Views on Vision4Press platform.
Data correspond to usage on the plateform after 2015. The current usage metrics is available 48-96 hours after online publication and is updated daily on week days.
Initial download of the metrics may take a while.