Fig. 6.
Download original image
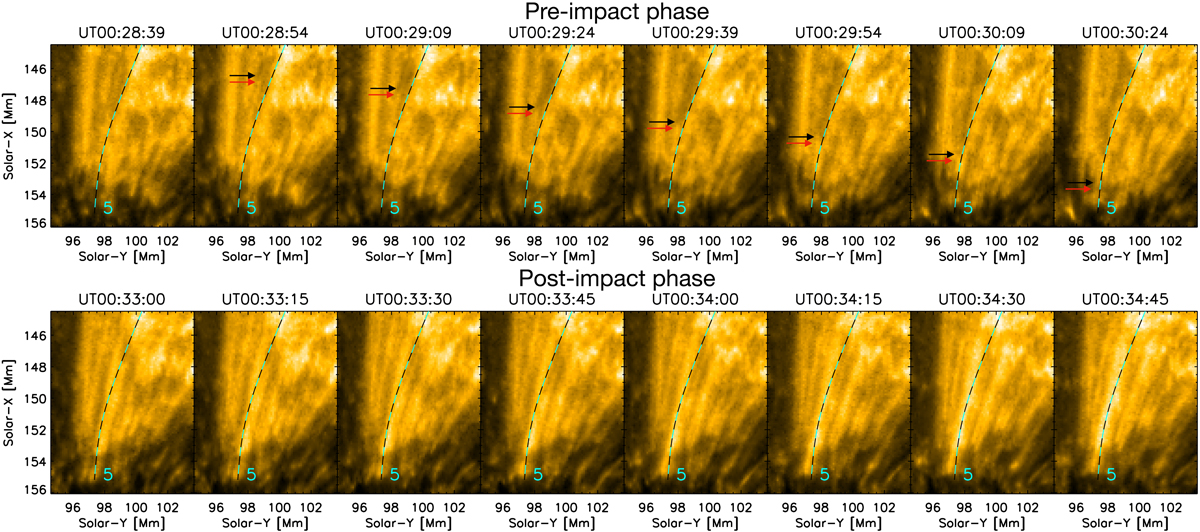
Sequence of eight snapshots separated by 15 s showing the pre- (top) and post-impact (bottom) phases of a coronal rain shower from the event of March 30. The black arrows in the top panels show the head of a rain clump as it falls (note the bright tip indicated by red arrows, followed by a dark elongated structure). For reference, path 5 is shown in the figure with a dashed cyan-black curve (same labelling as in Fig. 5). The lower panel shows a bright upward-propagating feature corresponding to the combination of the rebound shock and flow produced by the impact of the rain shower. These images have been processed with the wavelet-optimised whitening enhancement technique of Auchère et al. (2023).
Current usage metrics show cumulative count of Article Views (full-text article views including HTML views, PDF and ePub downloads, according to the available data) and Abstracts Views on Vision4Press platform.
Data correspond to usage on the plateform after 2015. The current usage metrics is available 48-96 hours after online publication and is updated daily on week days.
Initial download of the metrics may take a while.