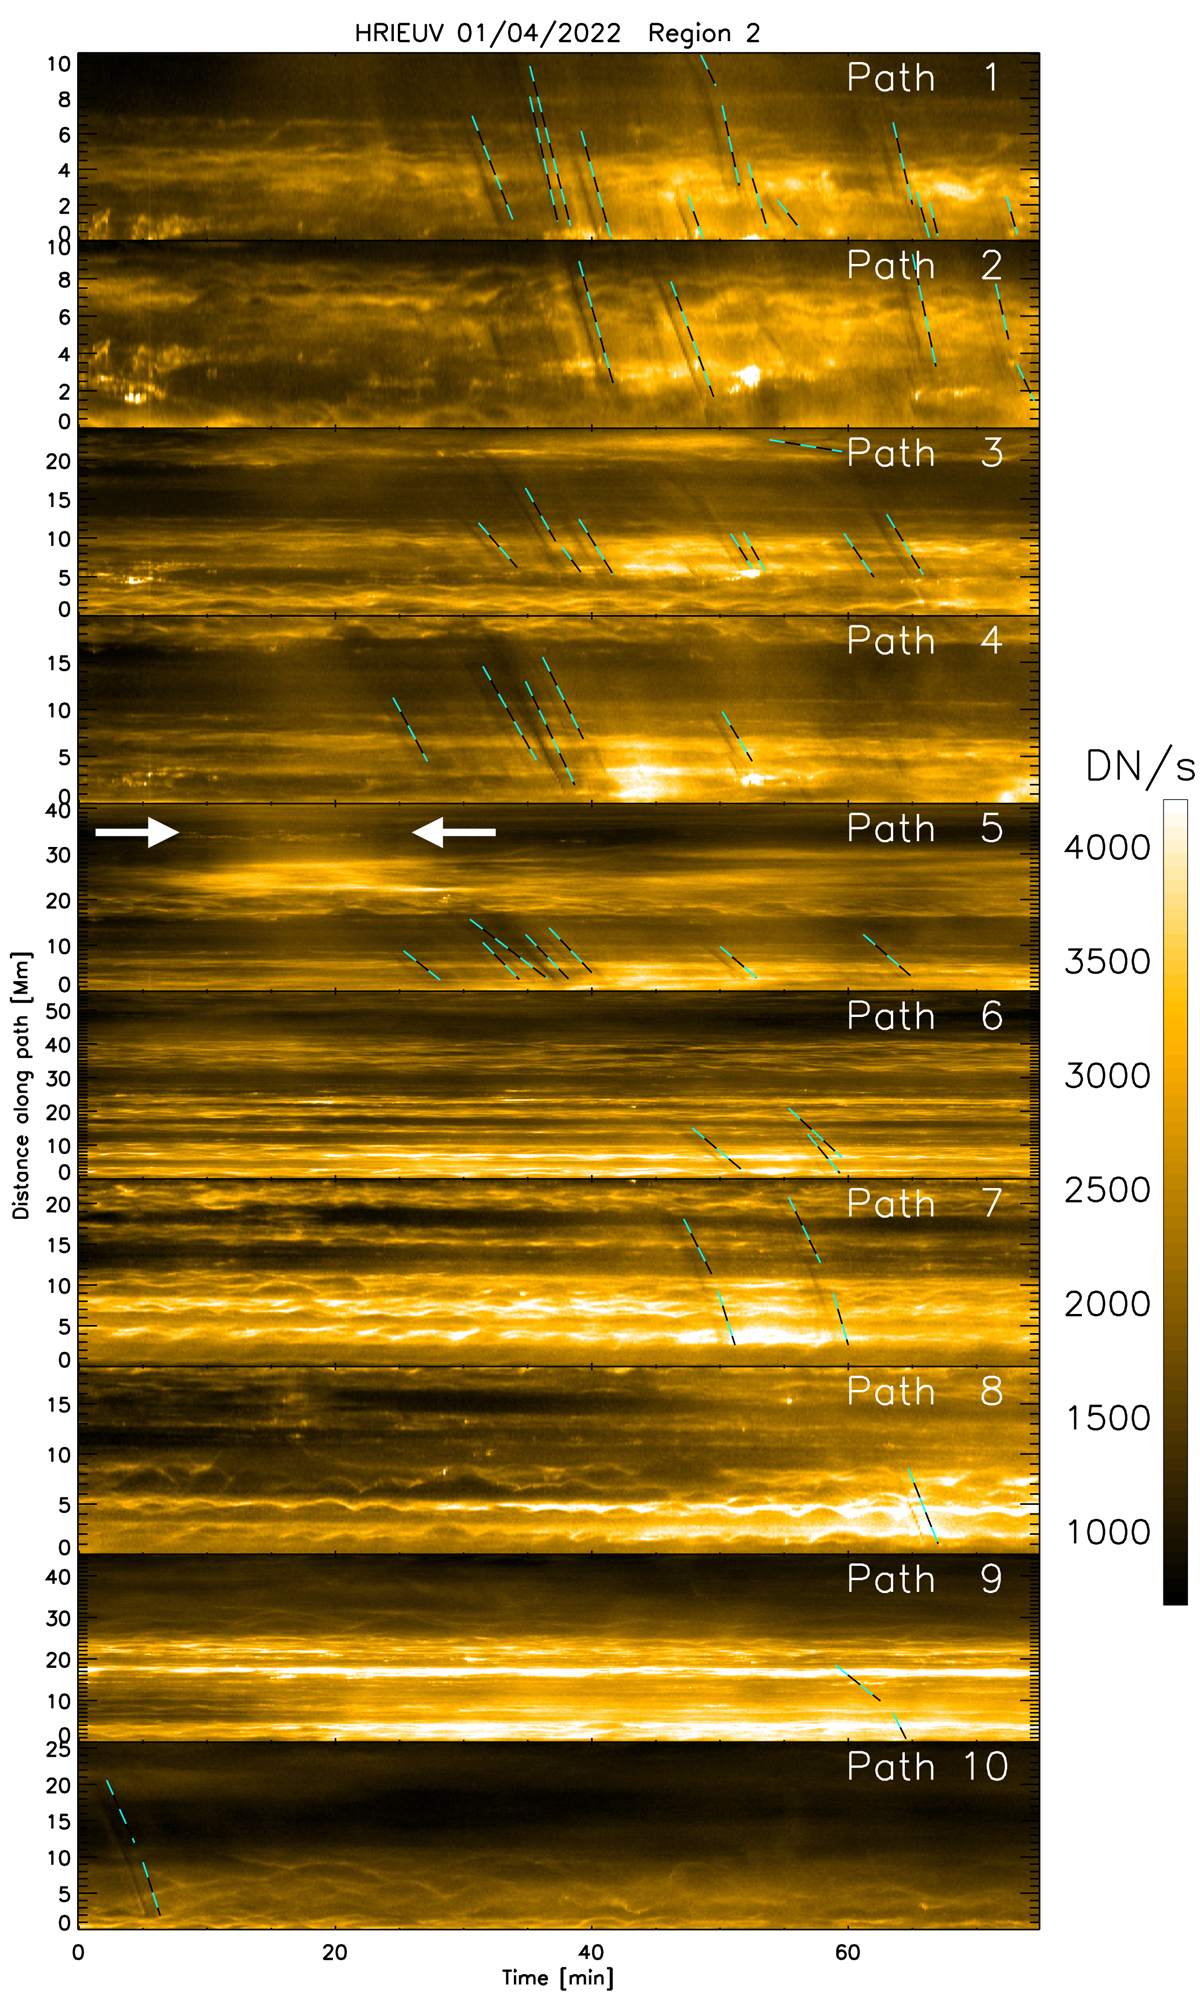
Fig. B.2.
Download original image
Time-distance diagrams for the paths of the rain clumps shown in Figure 11. The dashed cyan-black lines correspond to coronal rain tracks along the paths, with zero distance corresponding to the loop footpoints on the right side in Figure 11. The lines are offset in time by 1 min to show the rain features better. The white arrows in the time-distance diagrams for path 5 indicate the times when the loop brightens prior to the appearance of the rain.
Current usage metrics show cumulative count of Article Views (full-text article views including HTML views, PDF and ePub downloads, according to the available data) and Abstracts Views on Vision4Press platform.
Data correspond to usage on the plateform after 2015. The current usage metrics is available 48-96 hours after online publication and is updated daily on week days.
Initial download of the metrics may take a while.