Fig. B.1.
Download original image
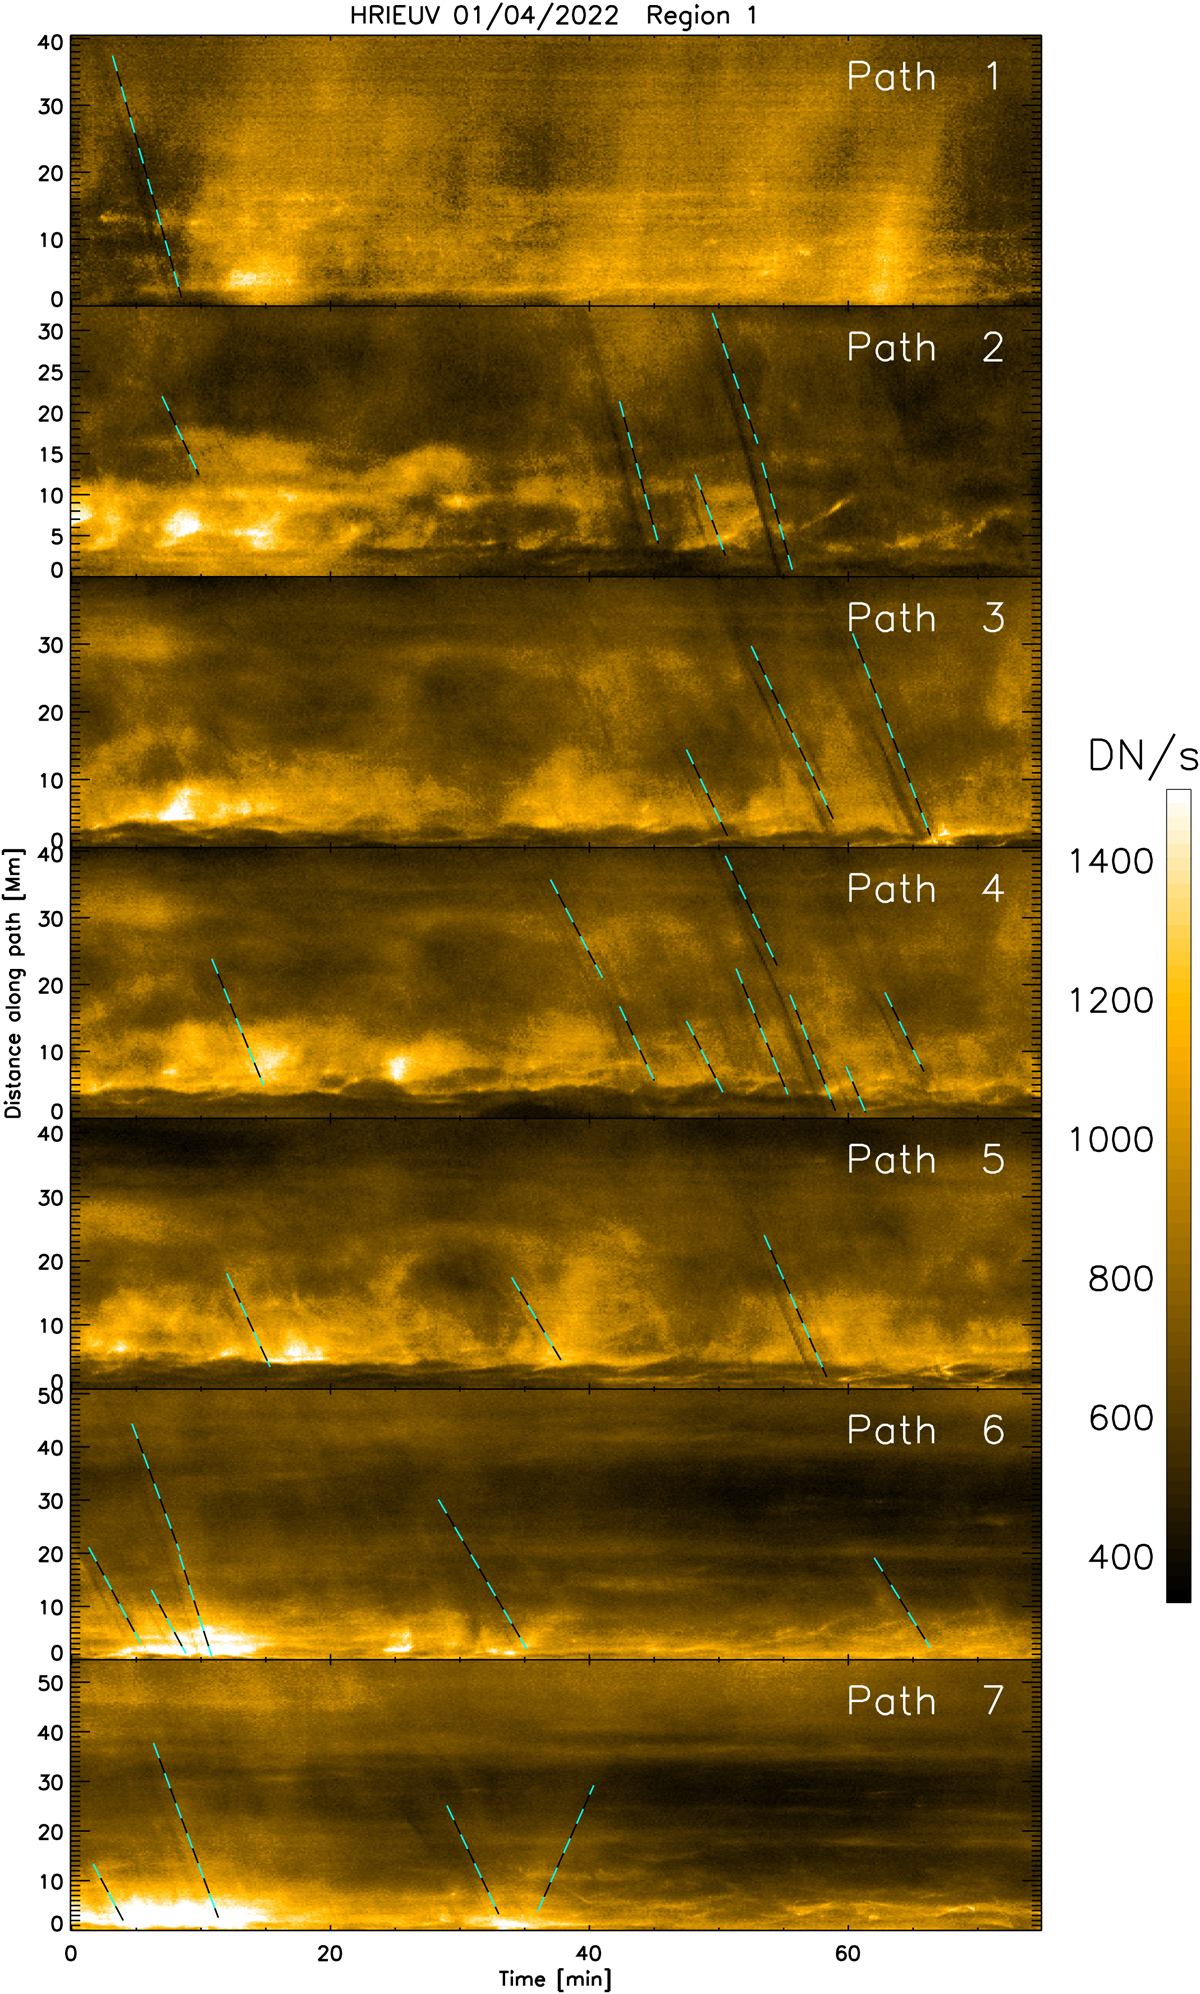
Time-distance diagram for the rain paths tracked in region 1 shown in Figure 10. The dashed cyan-black lines with negative slopes track the dark or bright absorption or emission features produced by several rain clumps falling into the chromosphere. A few bright upward-propagating features can also be seen (positive slopes). Zero distance corresponds to the footpoint of the loop (top right panel of Figure 10).
Current usage metrics show cumulative count of Article Views (full-text article views including HTML views, PDF and ePub downloads, according to the available data) and Abstracts Views on Vision4Press platform.
Data correspond to usage on the plateform after 2015. The current usage metrics is available 48-96 hours after online publication and is updated daily on week days.
Initial download of the metrics may take a while.