Fig. 24.
Download original image
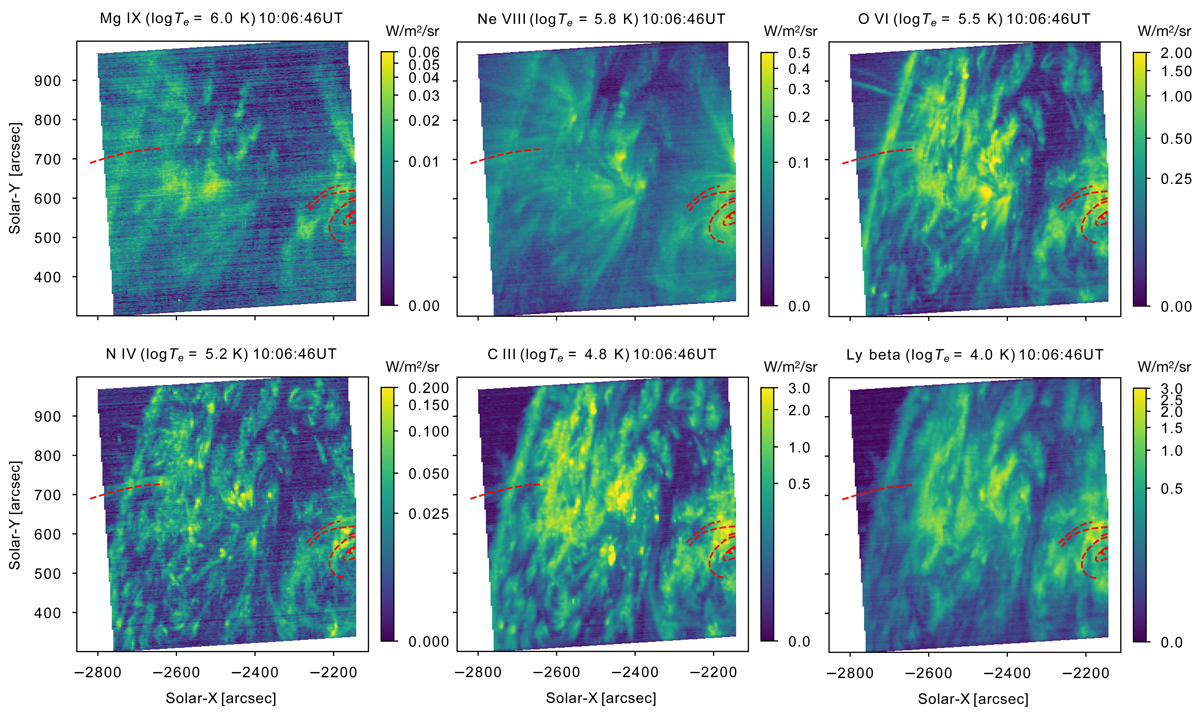
SPICE multi-wavelength full FOV on April 1st. The SPICE FOV is the same as was shown in Fig. 2 (bottom), co-aligned with HRIEUV. The overlaid red curves denote some of the rain paths seen with HRIEUV (see Figs. 10 and 11). Each SPICE panel shows the total intensity over a spectral line indicated in the subtitle, together with its temperature of maximum formation.
Current usage metrics show cumulative count of Article Views (full-text article views including HTML views, PDF and ePub downloads, according to the available data) and Abstracts Views on Vision4Press platform.
Data correspond to usage on the plateform after 2015. The current usage metrics is available 48-96 hours after online publication and is updated daily on week days.
Initial download of the metrics may take a while.