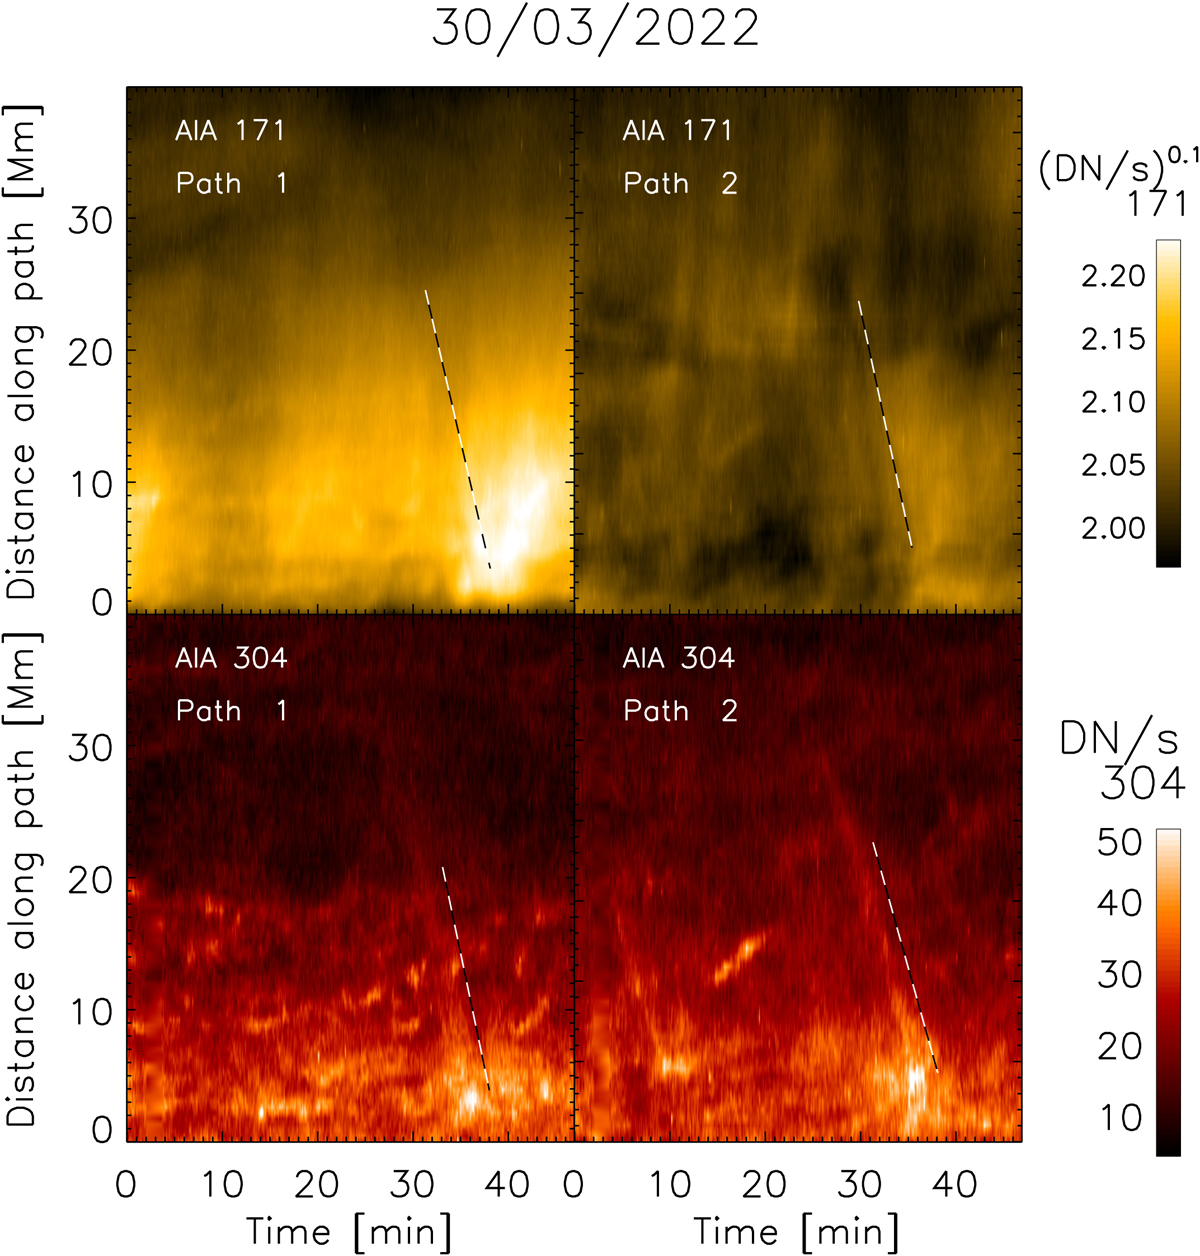
Fig. 21.
Download original image
SDO/AIA observation in the 171 (left) and 304 (right) channels of the April 1st coronal rain events. AIA was roughly in quadrature with Solar Orbiter on this date. Some of the large loop bundles observed by HRIEUV can be easily identified. The dashed white-black paths follow some rain clumps belonging to these loop bundles that are observed in AIA 304. Path 1 follows the same loop bundle as in region 1 of Fig. 10. Paths 2 and 3 may correspond to the same rain events that were shown in paths 8 or 9 in region 2 of Fig. 11. Paths 4 and 5 follow the same loop bundle as was shown in the lower part of Fig. 13 (paths 1 to 6 in that figure). An animation corresponding to this figure is available online. The animation shows widespread rain in AIA 304, but the counterparts in AIA 171 can only clearly be seen for the loop around path 1, although strong intensity variations are observed at the same locations. The animation runs from UT 09:20 to UT 10:32 and comprises the time where coronal rain is observed with HRIEUV. It first runs without and then with the rain paths overlaid.
Current usage metrics show cumulative count of Article Views (full-text article views including HTML views, PDF and ePub downloads, according to the available data) and Abstracts Views on Vision4Press platform.
Data correspond to usage on the plateform after 2015. The current usage metrics is available 48-96 hours after online publication and is updated daily on week days.
Initial download of the metrics may take a while.